Apparel and athleticwear retailers have seen material slowdowns in their businesses amid rising inflation and the looming resumption of student loan repayments, raising the level of debate about the health of Nike’s business heading into its Q1 2024 earnings report. Insights from “The Crowd” of real shoppers indicates Nike’s business should have seen some downward pressure in recent months but appears more resilient than most others.


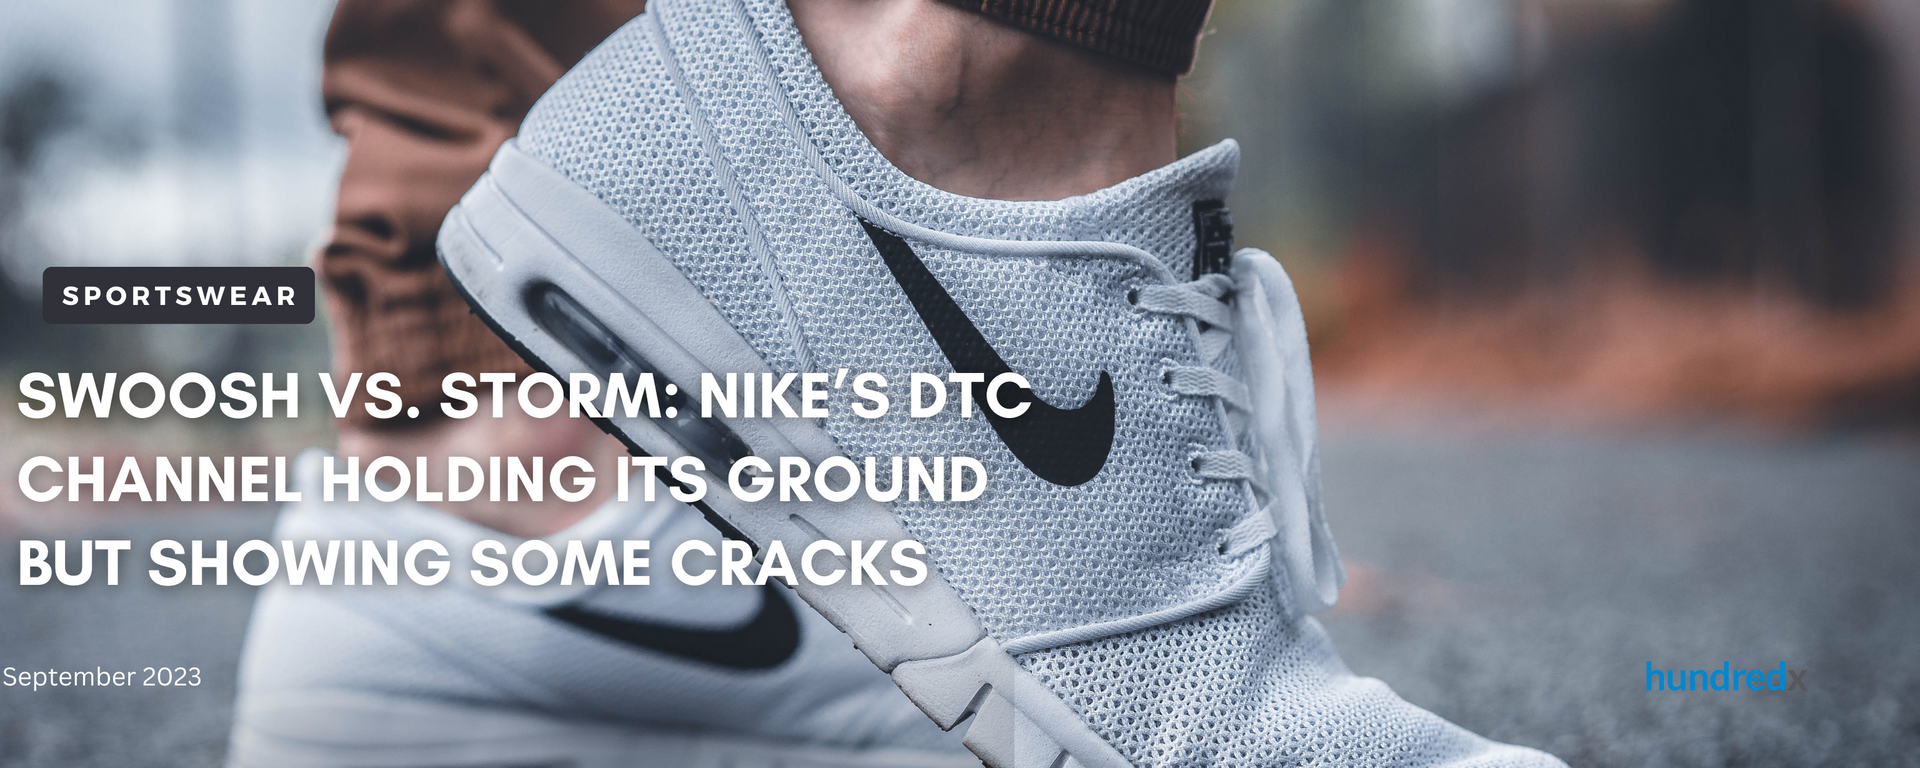
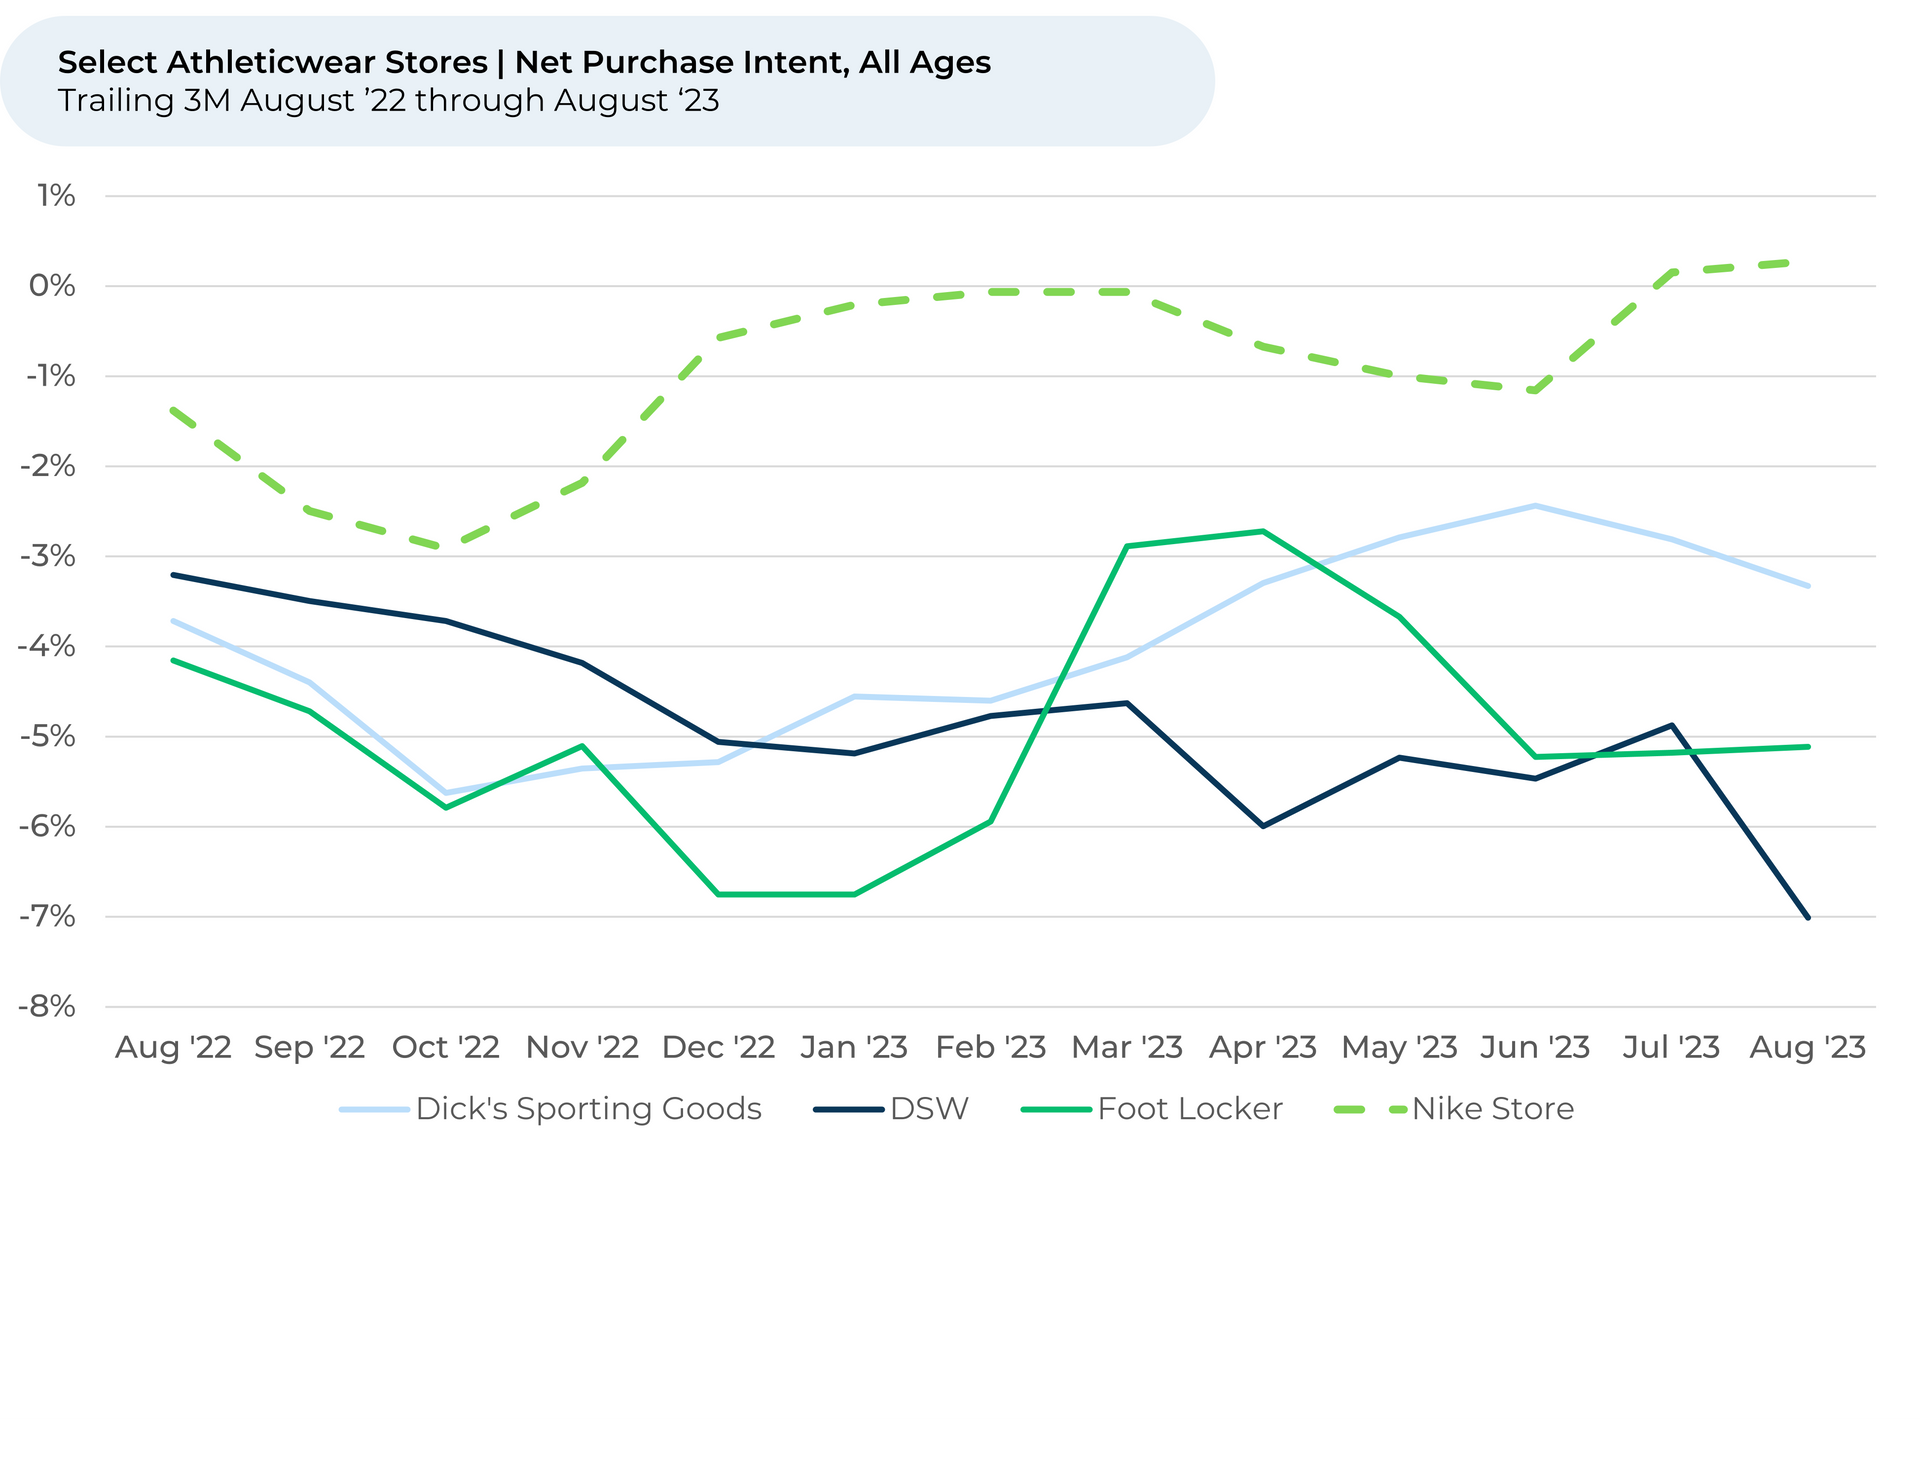
Despite the economic headwinds, we find Nike's direct-to-consumer (DTC) channel has bucked the trend with a modest 2% uptick in Purchase Intent¹,² year-over-year in August for the Nike Store, unlike retail partners DSW and Foot Locker who are witnessing dips in both Purchase Intent and reported US sales. However, HundredX did see Purchase Intent for people under 40 dip 1% in August vs. July 2023, the first decline in over a year. This indicates demand growth is starting to crack among Gen Z and millennials, important customer groups for the sportswear company. While young adults still love the swoosh, the impending crunch on disposable income might pose a problem for Nike in the coming months.


Analyzing more than 260,000 pieces of feedback across apparel, fashion, and footwear stores over the last year, including more than 20,000 on just Nike, we find:

Key Takeaways

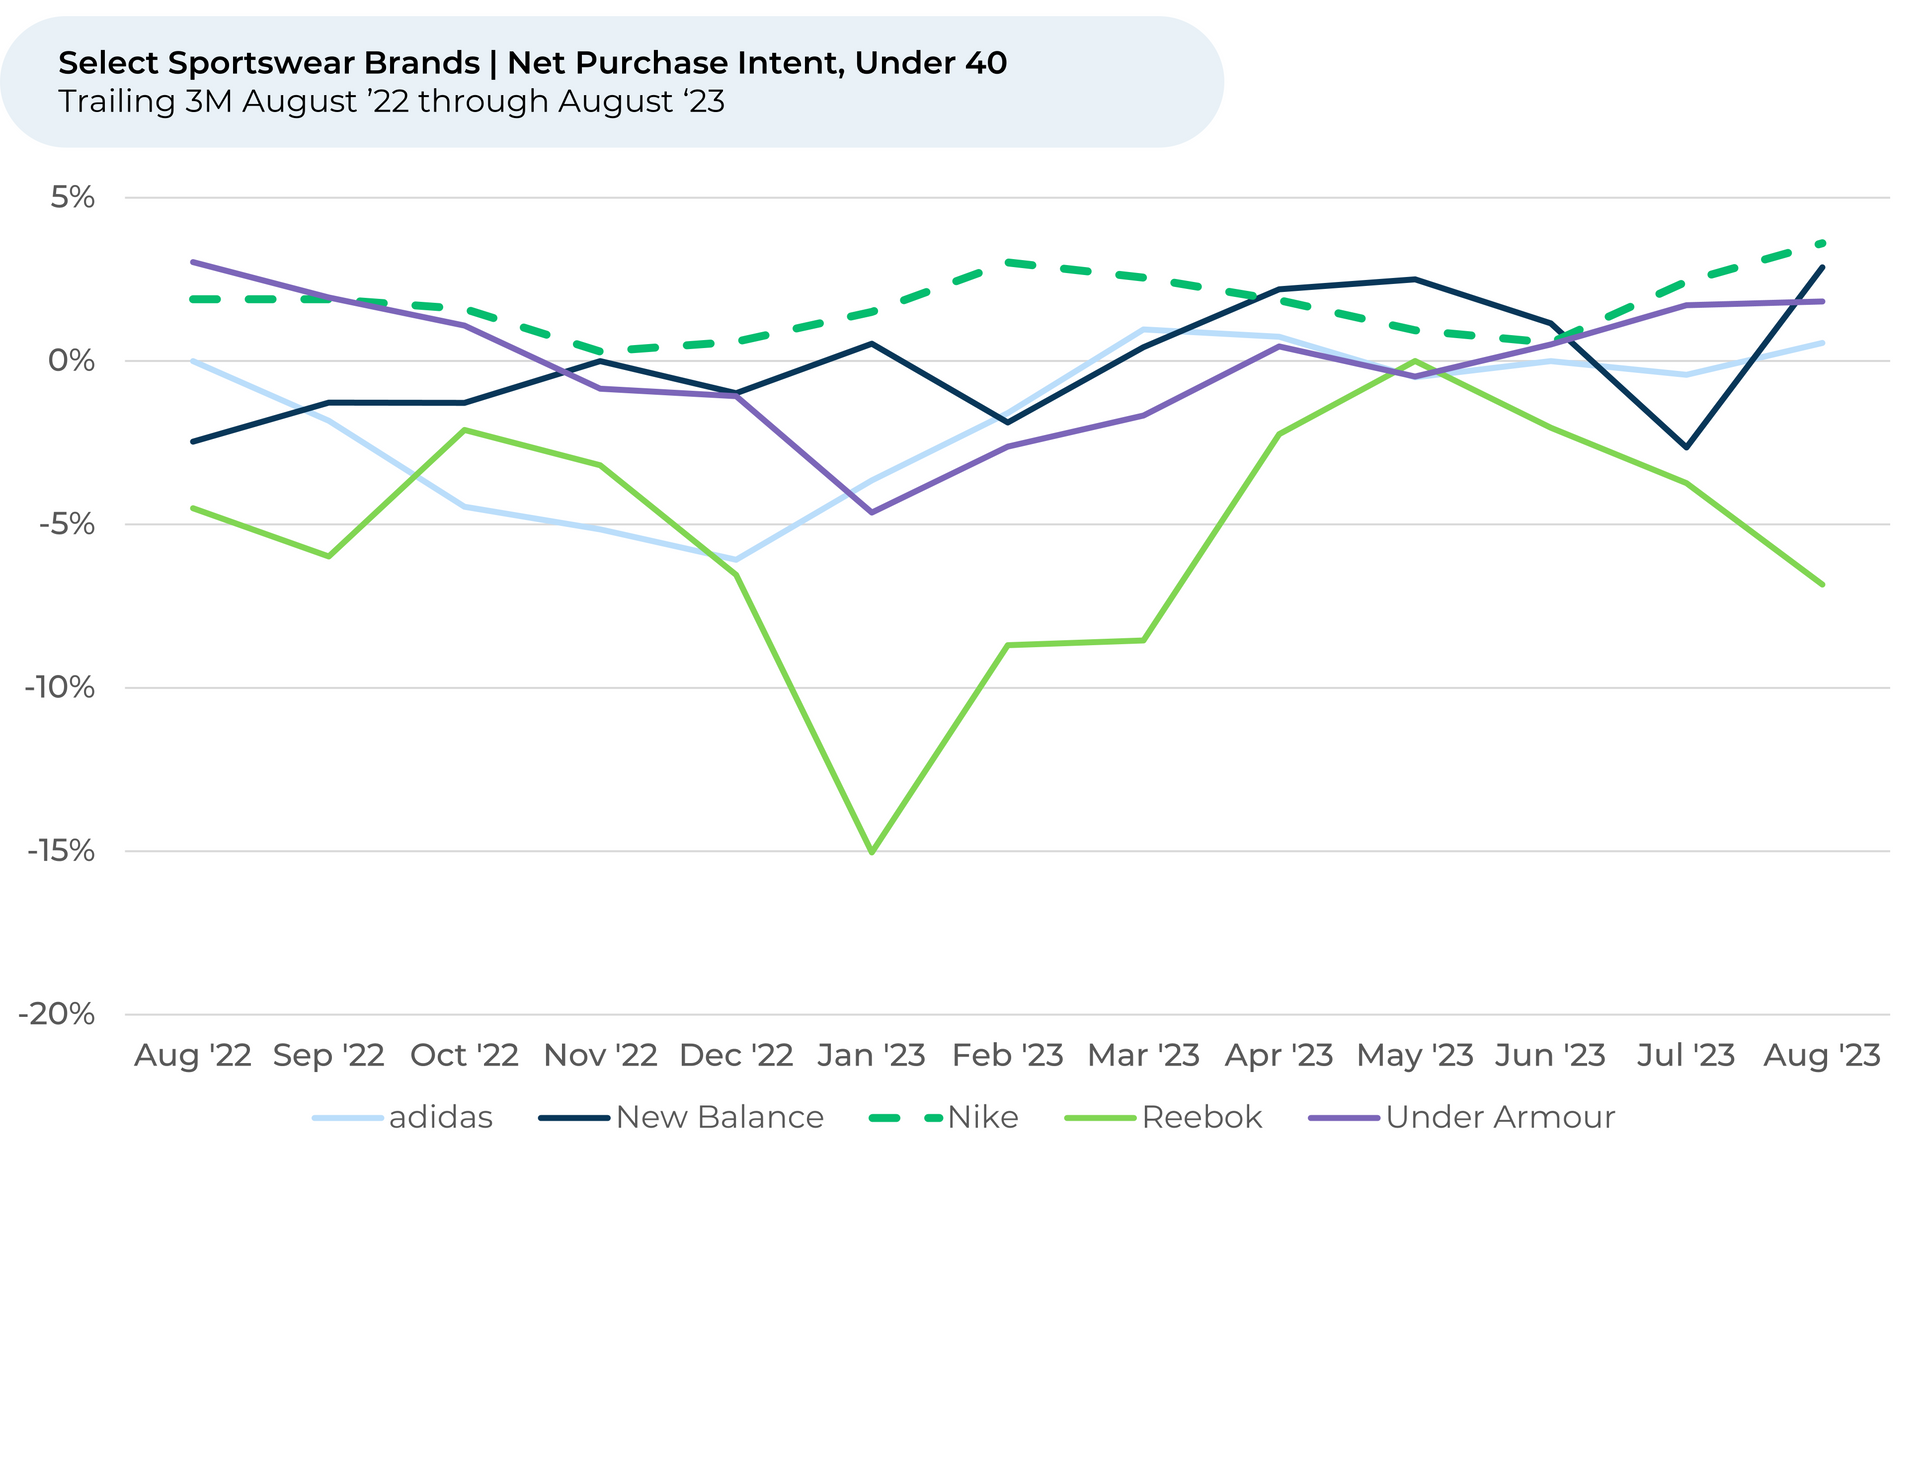
  • The Nike brand shows the most growth potential among young adults when compared to major athleticwear competitors, though it has seen increasing competition recently from Under Armour and New Balance.
  • Nike's DTC business should remain strong with the Nike Store seeing a 2% increase in Purchase Intent in August vs. a year ago, rebounding the last three months (L3M) after a dip in the spring. This contrasts 2% and 1% declines for DSW and Foot Locker respectively L3M.
  • Nike Store saw a 1% dip in Purchase Intent among adults under 40 from July to August, in line with 1%-2% declines for Dick’s Sporting Goods, Foot Locker and DSW.
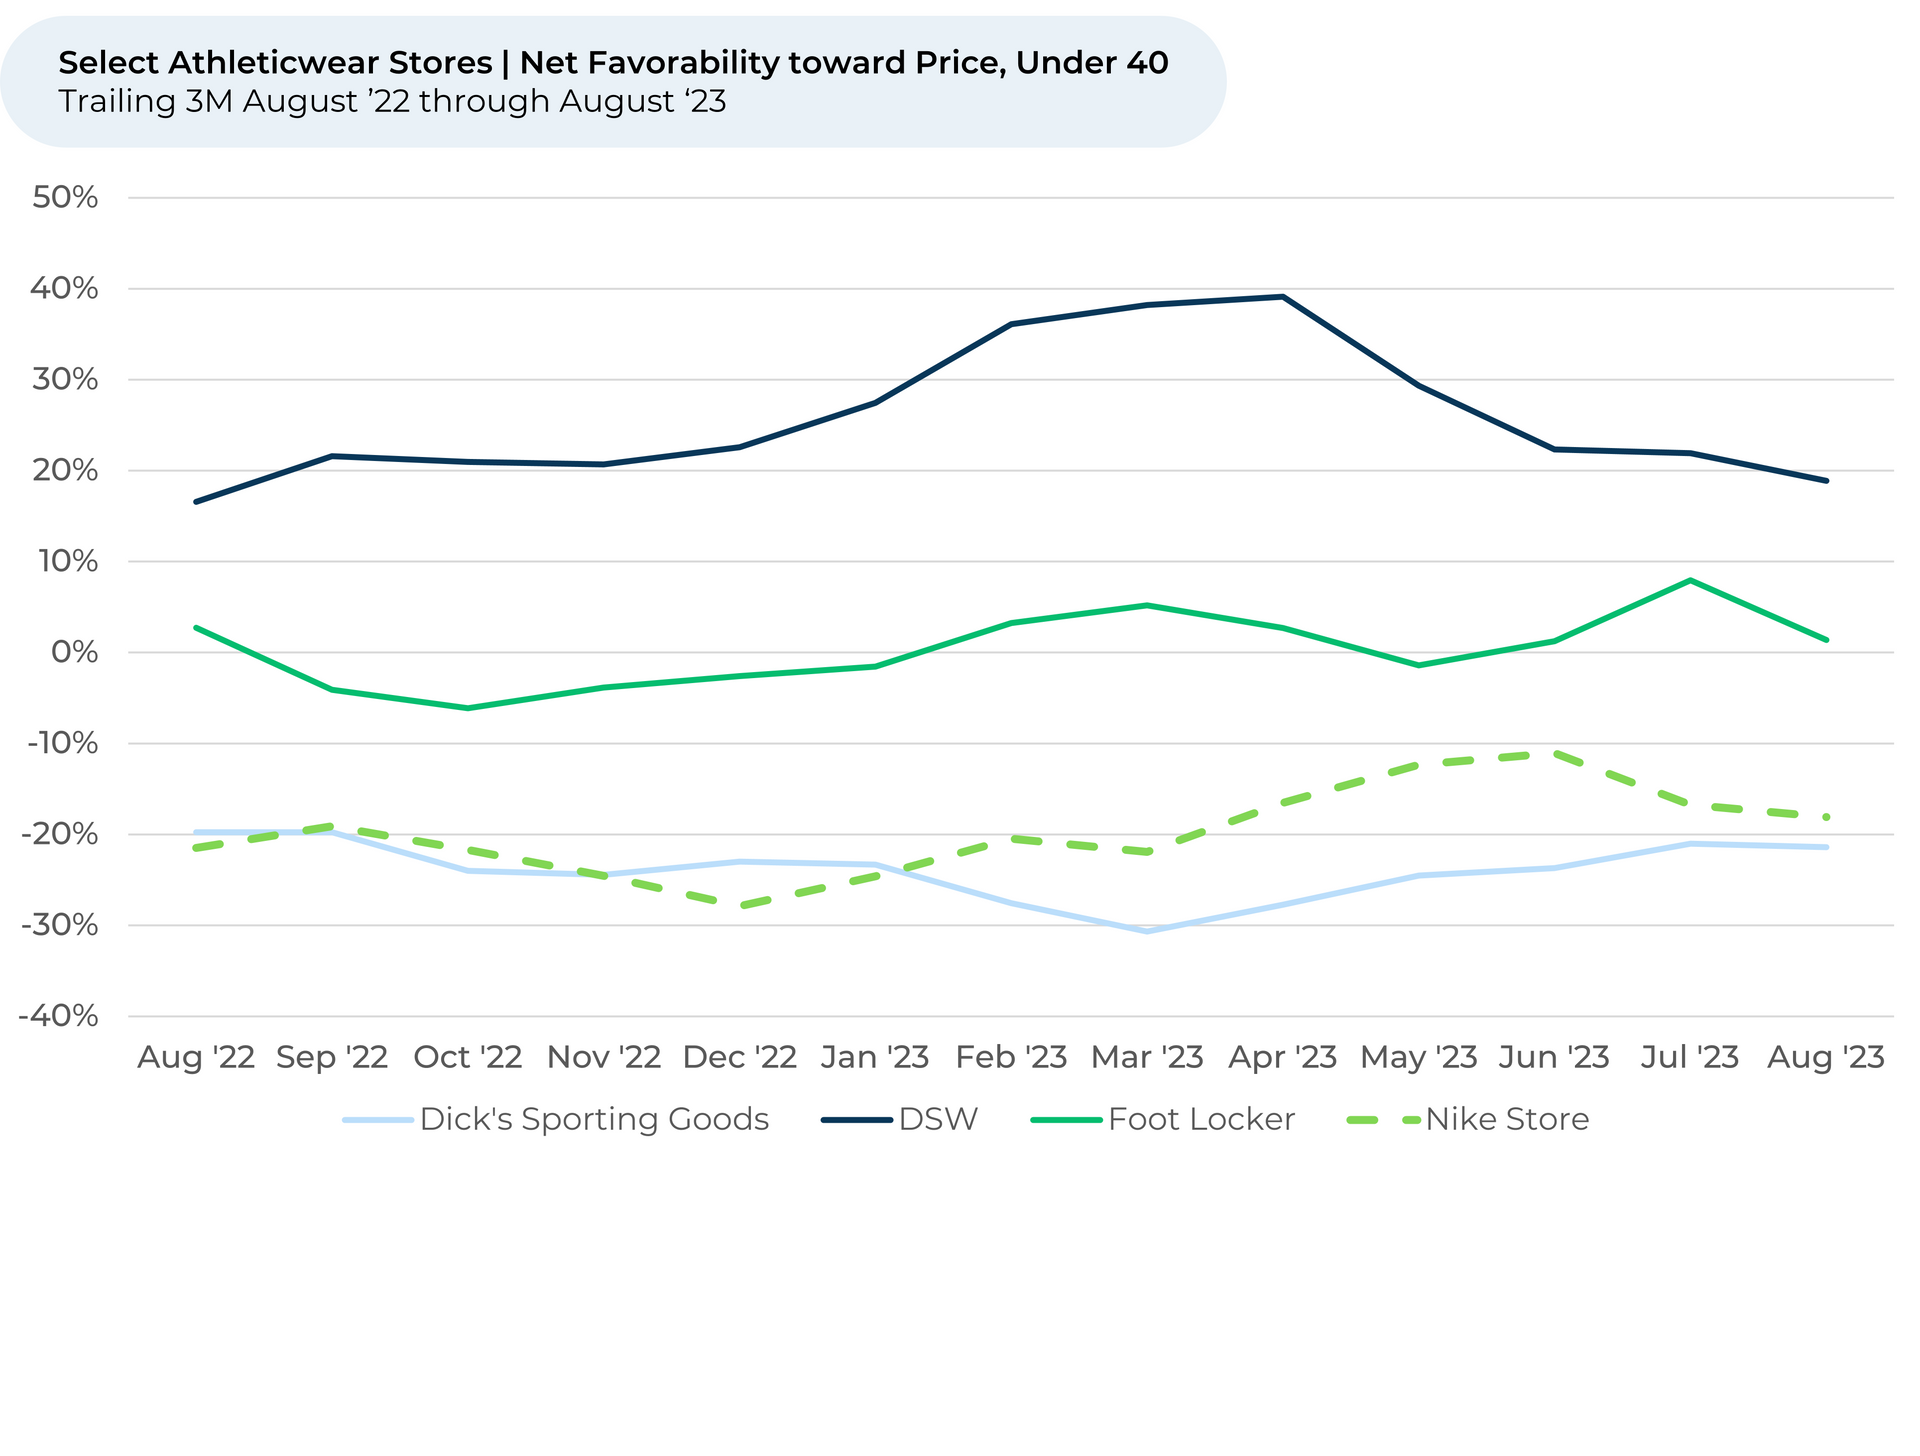
  • Notably, the Purchase Intent dips correspond to growing unhappiness among young adults about the prices³ at Nike Stores and other footwear retailers. Nike and others may be forced to use discounting to support demand through the critical holiday shopping season.

Discover HundredX insights into Nike Trends:

  • Slide title

    Write your caption here
    Button
  • Slide title

    Nike has seen its growth outlook with young adults strengthen more than most of its biggest rivals. Purchase Intent with this group is up 2% in August vs. a year ago for Nike, less than +5% for New Balance but more than all others who are -2% to +1%. Adults under 40 are more likely to recommend Nike to a friend than they are any of Nike’s rivals. 

    Button
  • Slide title

    Purchase Intent for some of the third-party retailers Nike is focused on growing its relationship with is declining, down 4% for DSW and 1% for Foot Locker in August vs. a year ago. Nike Store purchase intent is up 2% vs. a year ago. 


    Button
  • Slide title

    However, the growth outlook for Nike’s stores is starting to show some weakness with adults under 40. Purchase Intent dipped more than 1% from July through August, mirroring similar drops with third-party retailers. We believe student loan repayments starting up again in October and rising inflation rates are weighing on young people’s spending plans.


    Button
  • Slide title

    The recent Purchase Intent dip for Nike Stores among young adults corresponds to growing unhappiness about the store’s prices. Net favorability toward Price dropped 7% from June through August, indicating Nike may need to use sales to support demand through the holiday shopping season.


    Button

Please contact our team for a deeper look at HundredX's fashion, apparel, and footwear data, which includes more than 670,000 pieces of customer feedback across close to 236 fashion-related brands.


  1. All metrics presented, including Net Purchase (Purchase Intent) and Net Positive Percent / Favorability, are presented on a trailing three-month basis unless otherwise noted.
  2. Purchase Intent represents the percentage of customers who expect to spend more with that chain over the next 12 months, minus those that intend to spend less. We find businesses that see Purchase Intent trends gain versus the industry or peers have often seen revenue growth rates, margins, and/or market share also improve versus peers.
  3. HundredX measures Net Favorability towards a driver of customer satisfaction as Net Positive Percent (NPP), which is the percentage of customers who view a factor as a positive (reason they liked the products, people, or experiences) minus the percentage who see the same factor as a negative.

Strategy Made Smarter


HundredX works with a variety of companies and their investors to answer some of the most important strategy questions in business:

  • Where are customers "migrating"?
  • What are they saying they will use more of in the next 12 months?
  • What are the key drivers of their purchase decisions and financial outcomes?


Current clients see immediate benefits across multiple areas including strategy, finance, operations, pricing, investing, and marketing.


Our insights enable business leaders to define and identify specific drivers and decisions enabling them to grow their market share.


Please contact our team to learn more about which businesses across 75 industries are best positioned with customers and the decisions you can make to grow your brand’s market share.

####


HundredX is a mission-based data and insights provider. HundredX does not make investment recommendations. However, we believe in the wisdom of the crowd to inform the outlook for businesses and industries. For more info on specific drivers of customer satisfaction, other companies within 75+ other industries we cover, or if you'd like to learn more about using Data for Good, please reach out: https://hundredx.com/contact.

Share This Article

06 May, 2024
Sure, lattes, mochaccinos, and cappuccinos are pricey, but they taste delicious. For many consumers, the great taste of coffee shop coffee made it worth the cost. But customers at Starbucks aren't so sure the tradeoff is worth it anymore. Examining more than 420,000 pieces of feedback across the Quick, Fast, Casual (QFC) industry, including over 21,000 on Starbucks, we find: Starbuck's Purchase Intent 1,2 is down 3% over the past six months, with most of that dip occurring over the past few months. By contrast, Dunkin' Donuts has remained within a tight range over the past six months, as did an average of other, smaller coffee chains. Customers increasingly see less value in Starbucks. Starbuck's Value perception 3 fell 5% over the past six months, compared to just 1% for Dunkin' Donuts. However, it also fell 5% for the average of the smaller coffee chains. Coffee drinkers feel significantly unhappier about Starbuck's quality and taste. Starbuck's Taste perception fell 4% over the past six months, while rising 1% for competitors. Likewise, its Quality perception dipped 3% over the same time period (and 8% over the year). Ultimately, Starbuck's perceived drop in taste is leading inflation-weary consumers to say they plan to spend less at the coffee chain, as the value just isn't as good.
06 May, 2024
Forbes Best Brands for Social Impact, Powered by HundredX
06 May, 2024
Ozempic once dominated the headlines, but GLP-1 competitor Mounjaro is winning over customers. GLP-1 drugs, used for treating diabetes and aiding in weight loss, are relatively new on the market yet have surged in popularity over the last year. They're becoming so popular that J.P. Morgan estimates that 30 million people in the US may be using a GLP-1 drug by 2030. This statistic presents a significant potential for early drug creator Novo Nordisk (Ozempic, Wegovy), and perhaps an even bigger one for Eli Lilly (Mounjaro, Zepbound). HundredX data indicates Eli Lilly is in a position to win over Novo Nordisk as Mounjaro's Usage Intent widens against the competition. Ozempic may have name recognition, but customers feel more positively about Mounjaro's effectiveness and lifestyle impact, even if they aren't excited about its high price. Examining 1,500 pieces of customer feedback across Mounjaro, Ozempic, and Wegovy, we find: GLP-1 users increasingly say they plan to use Mounjaro more, and Ozempic less . Mounjaro’s Usage Intent is up 19% since July, Wegovy’s is up 3%, and Ozempic has stayed within a tight range. Customers feel Mounjaro is more effective than competing drugs, but it’s harder to get . Mounjaro outperforms other GLP-1 drugs in effectiveness, lifestyle impact, and side effects. However, customers dislike its cost and availably more than competitors. GLP-1 users may be more likely to turn away from fast food and the gym. Compared to average HundredX respondents, the average GLP-1 customer says they are more likely to purchase less from QFC restaurants and food delivery services as well as use gyms and weight loss programs less.
Share by: