When the World Health Organization (WHO) flagged aspartame as a potential carcinogen, a surge of media discussions and concerns followed. However, has this buzz changed the mindset of the everyday soda drinker?
Our data indicates customers feel indifferent about the report, contrary to speculations from news agencies like CNBC that suggested the WHO’s report could hurt diet soda sales or lead manufacturers to find an alternative to aspartame.
Analyzing more than 150,000 pieces of customer feedback from 91 non-alcoholic beverages, we find:
Key Takeaways
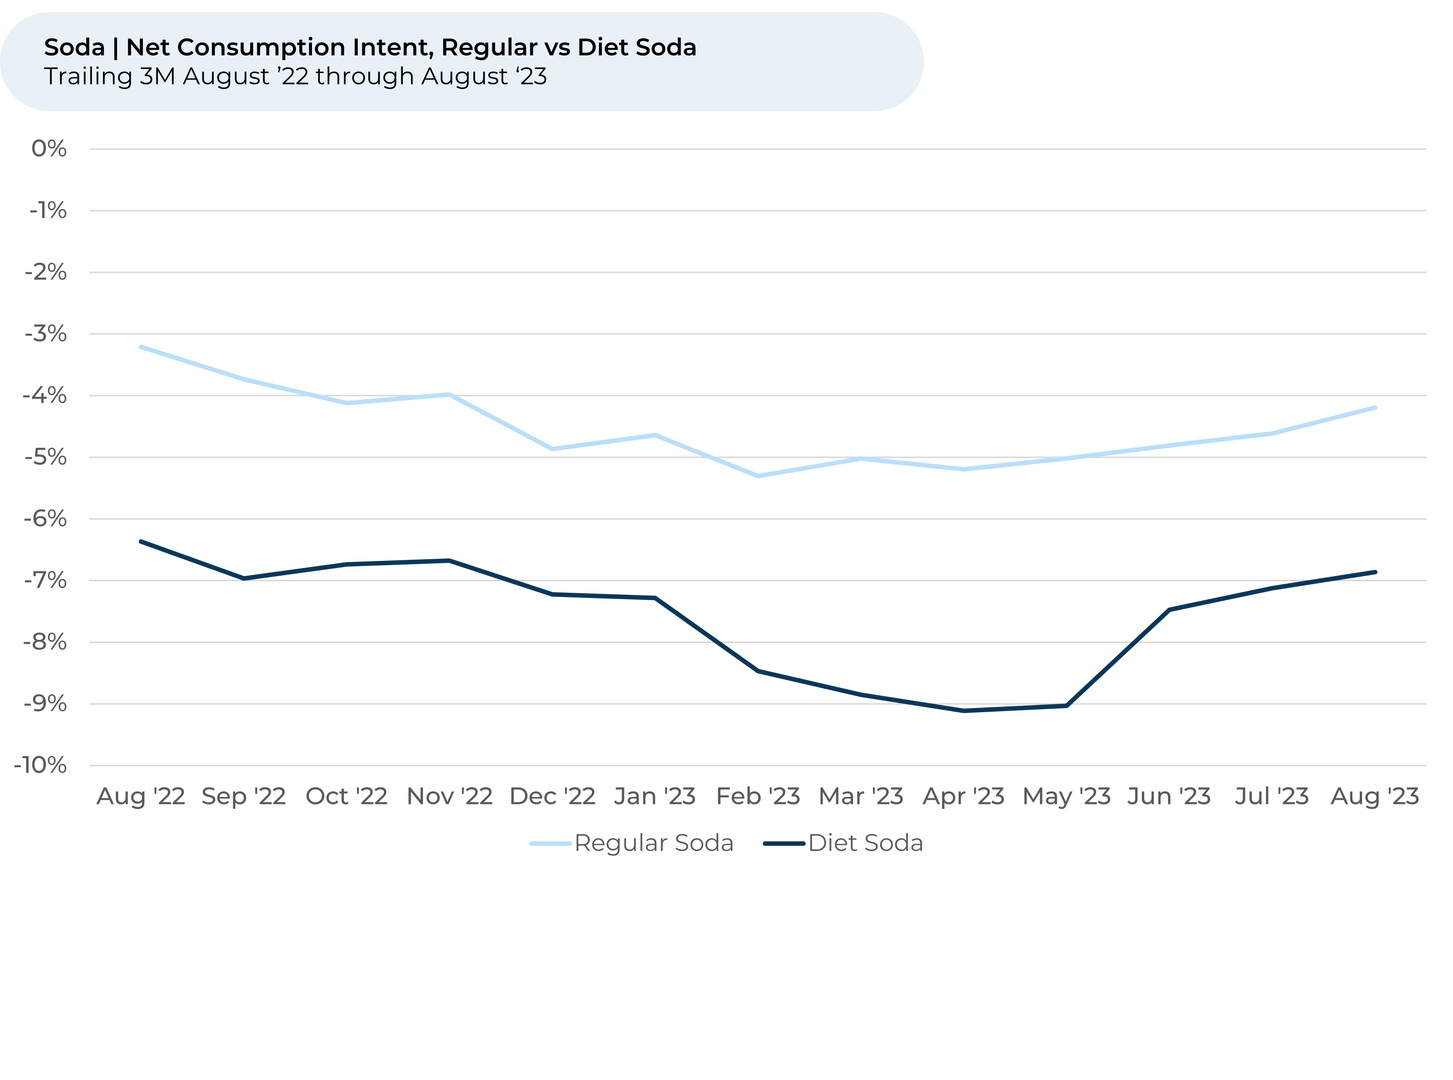
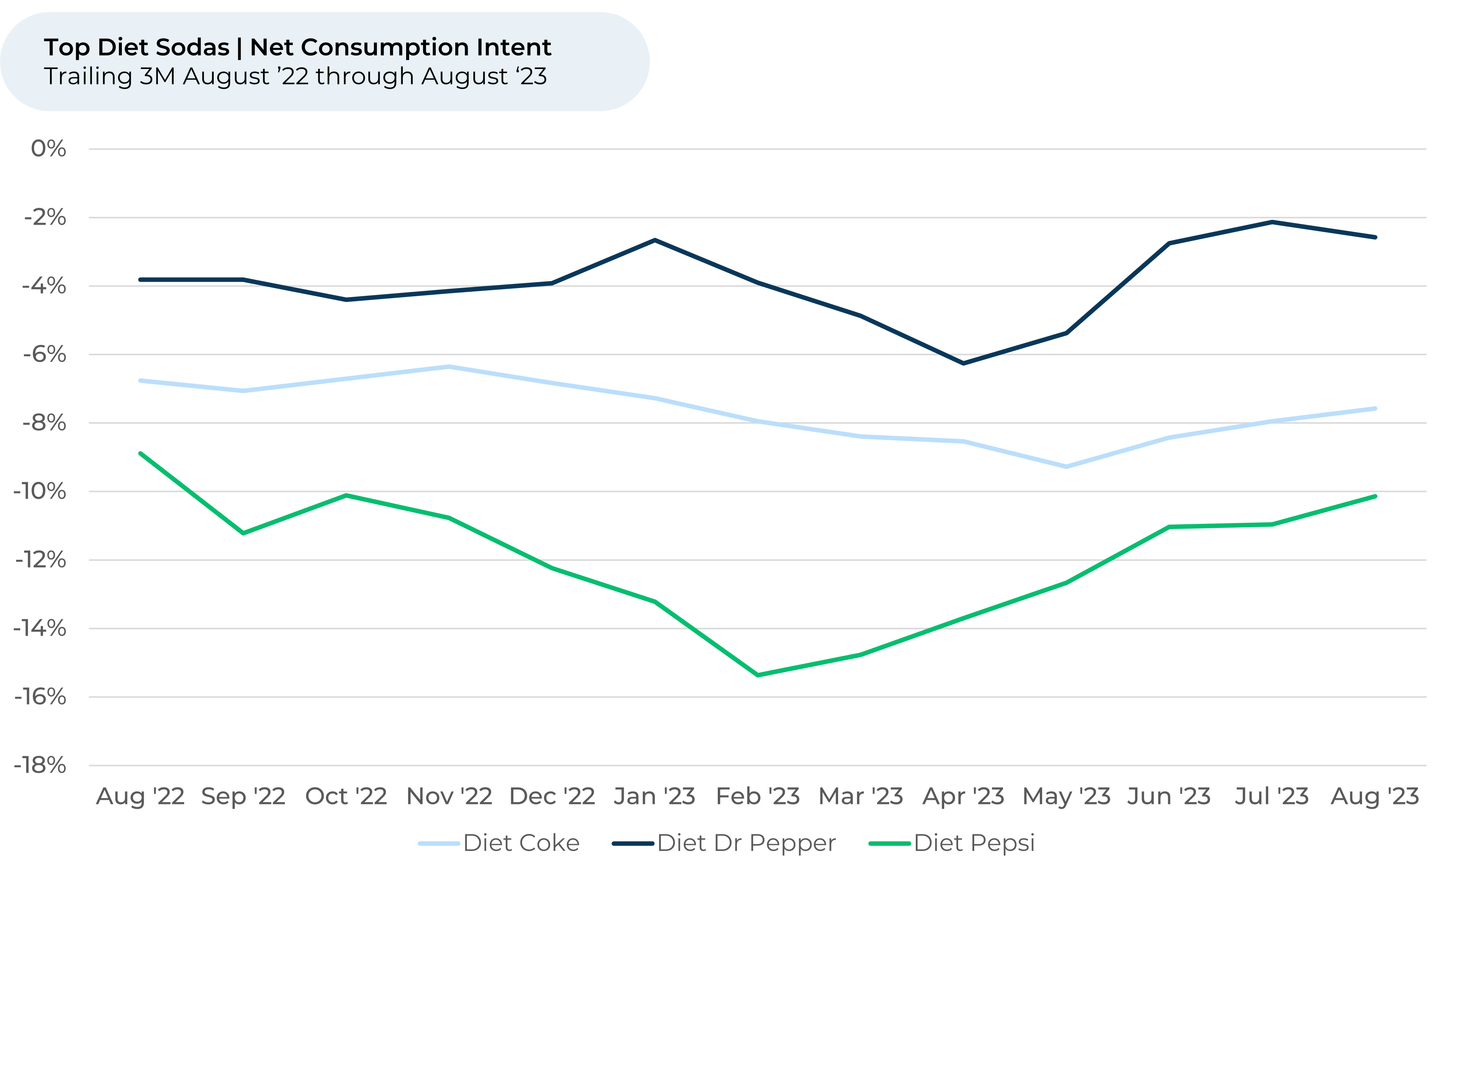
- Since May, Consumption Intent¹,² for top diet soda brands like Diet Coke, Diet Pepsi, and Diet Dr. Pepper grew by 2%, outpacing regular sodas, which saw a 1% rise. Notably, Diet Dr. Pepper led the pack with a 3% increase.
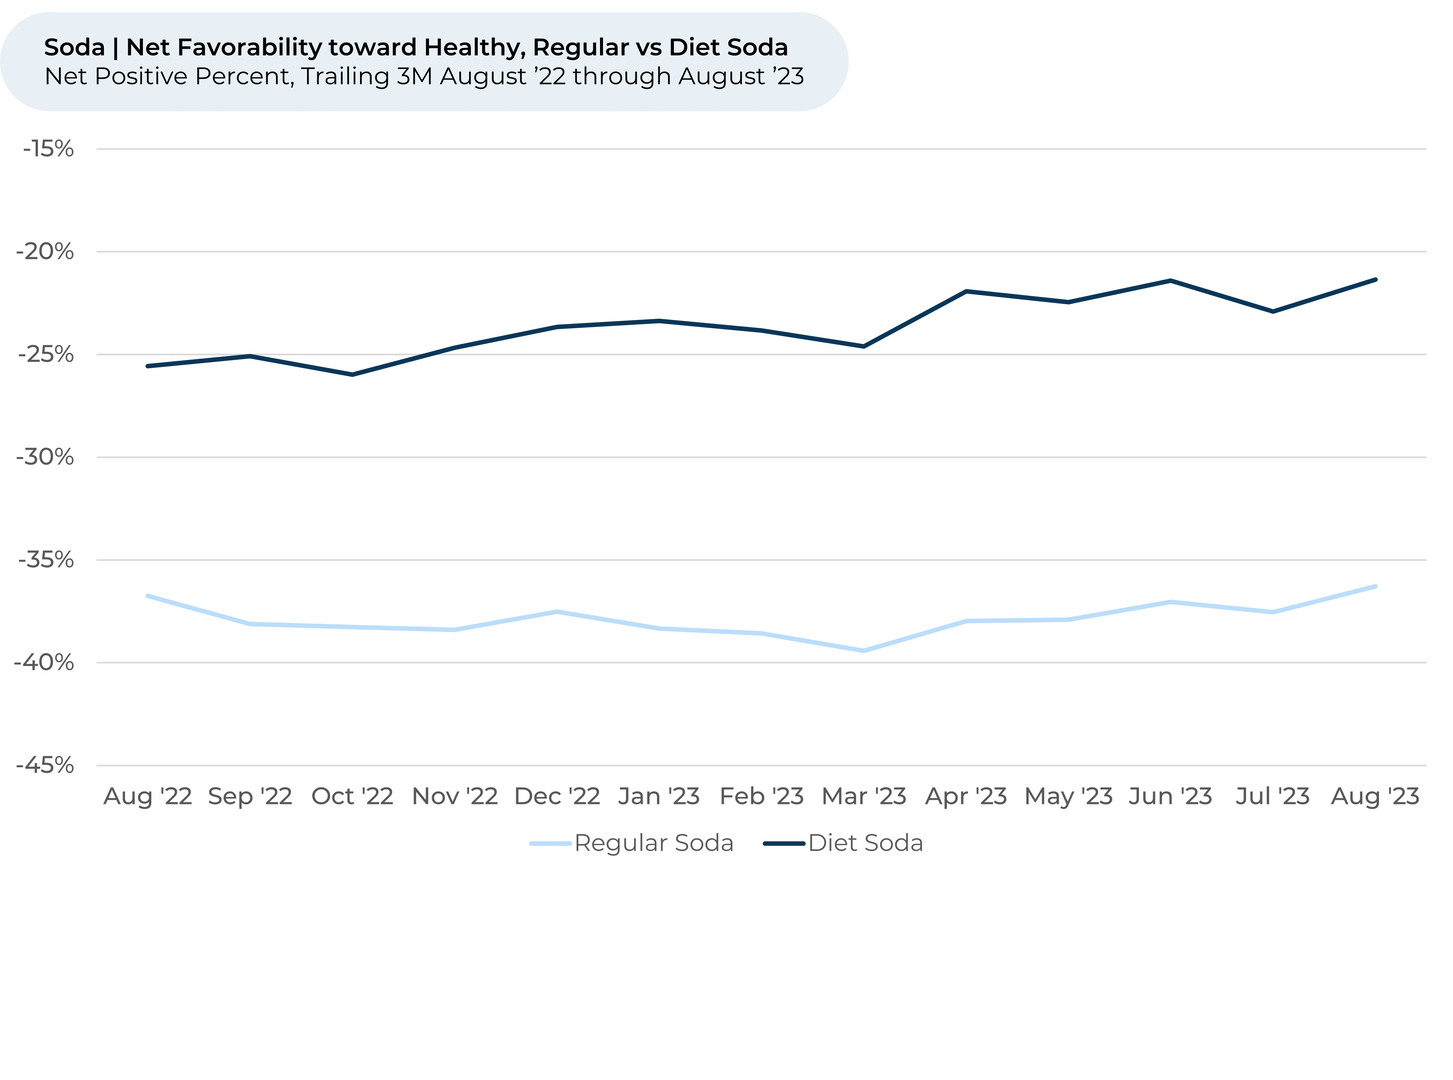
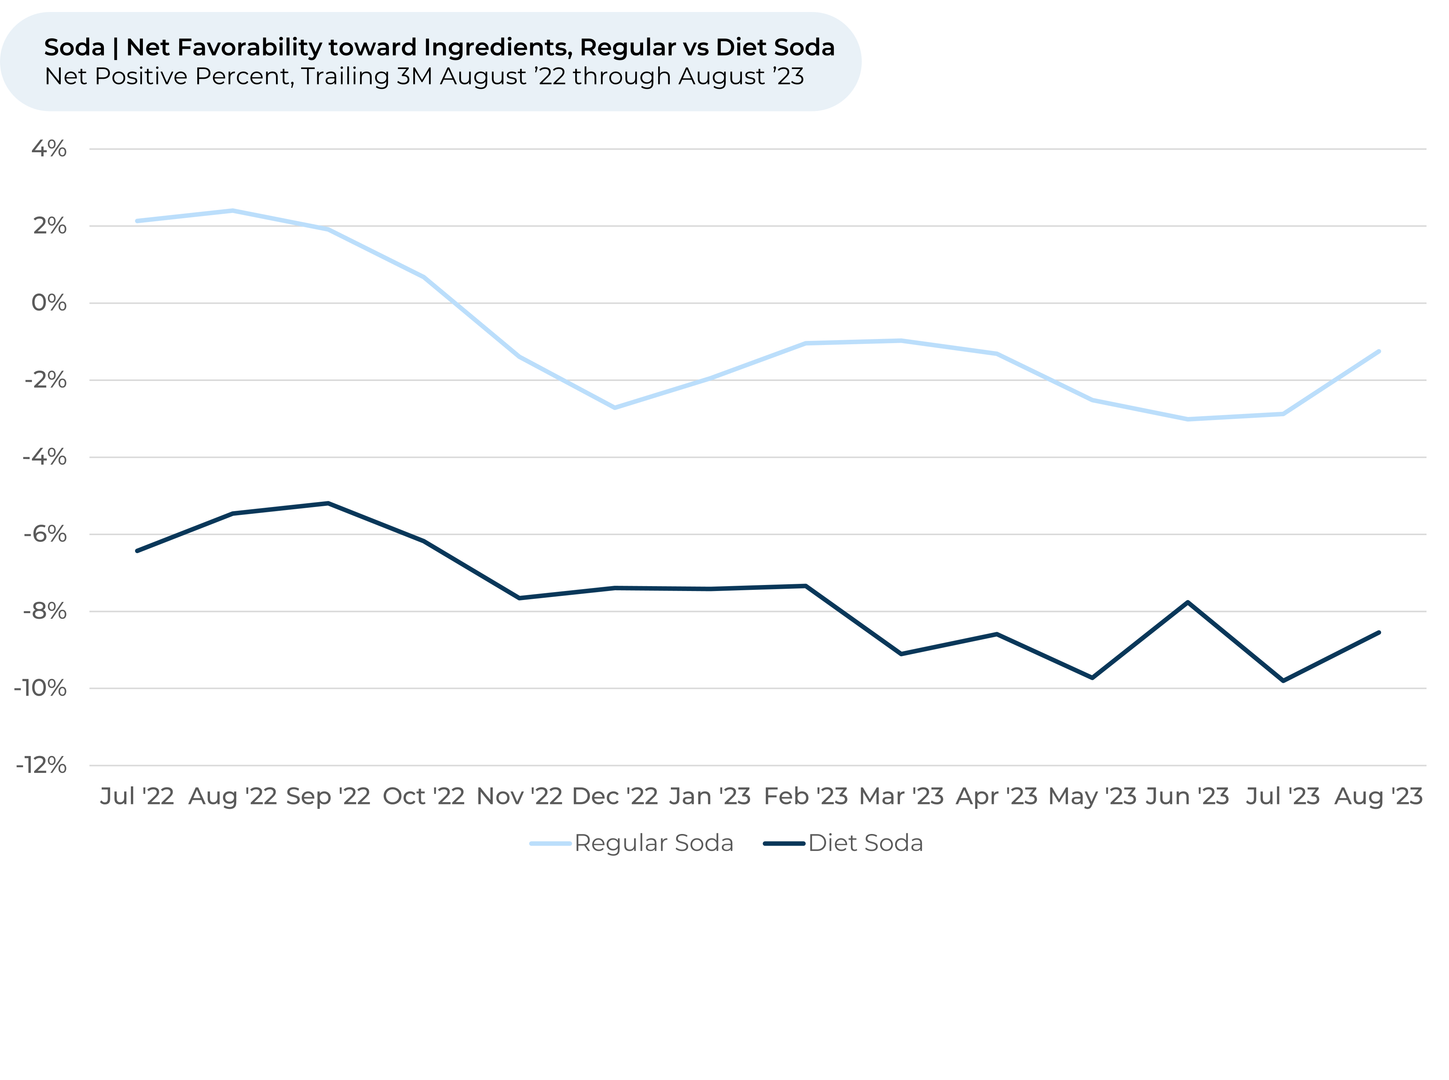
- Despite the WHO's report and its vast media coverage, there hasn't been a notable shift in consumers' sentiments regarding the healthiness or ingredients of diet sodas. In fact, net favorability³ towards these factors remained consistent or better over the past three months for both diet and regular sodas.
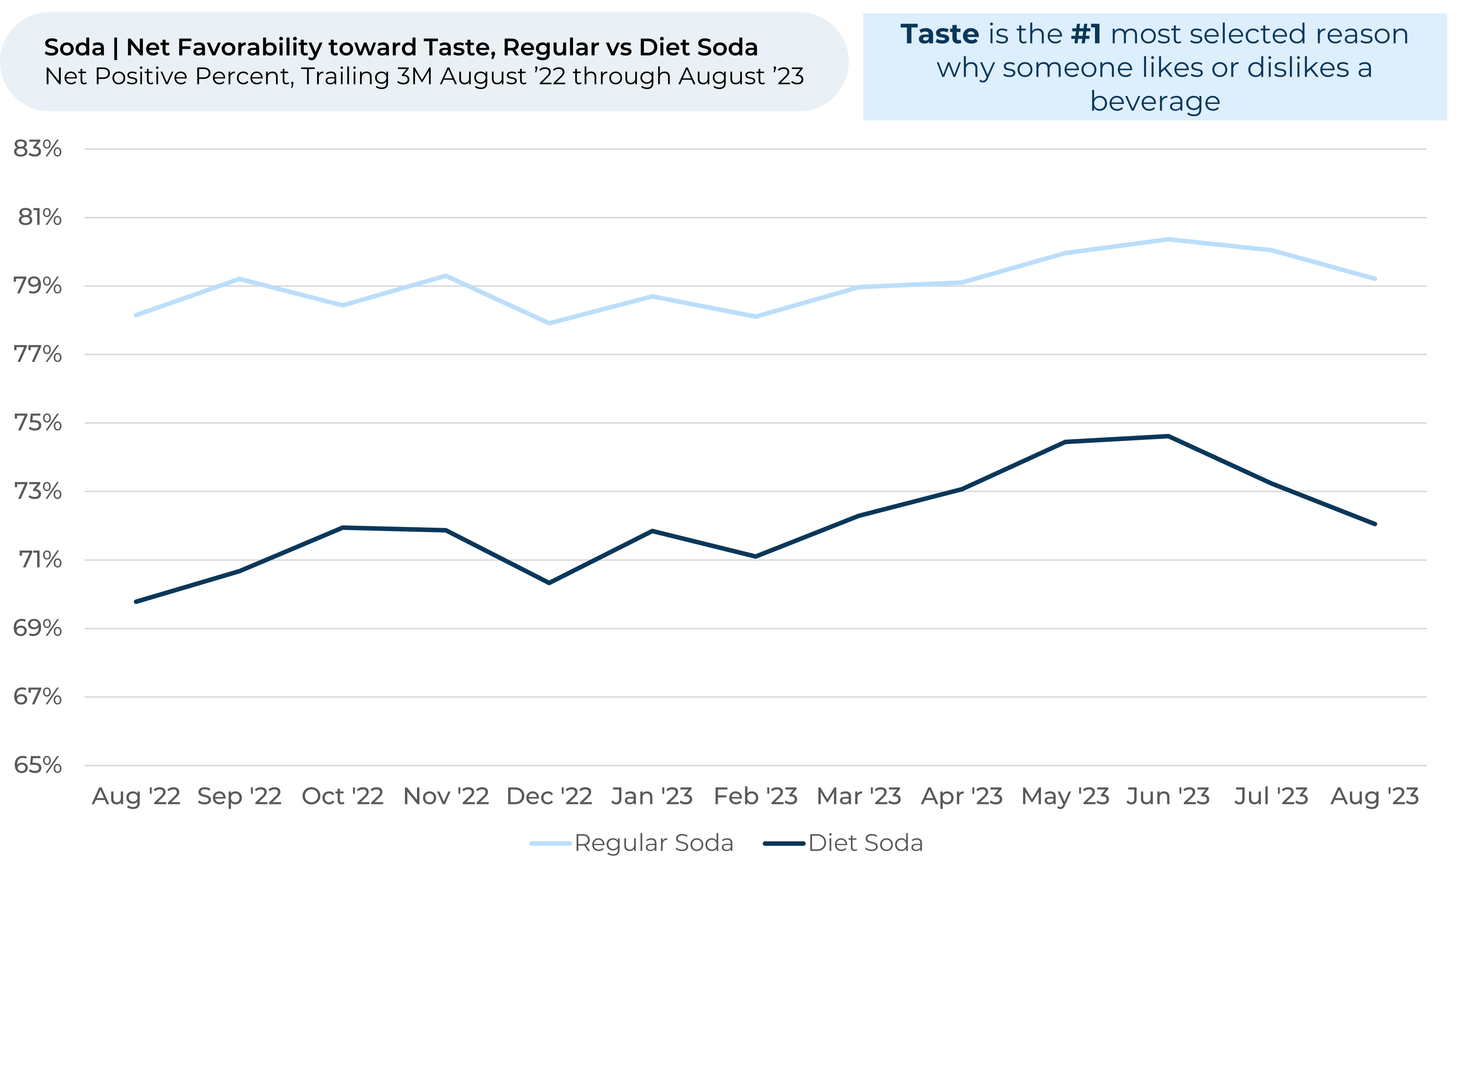
- Interestingly, diet soda drinkers are less pleased with the taste of diet soda lately. Since May, net favorability toward Taste dropped 2% for diet soda, while dropping less than 1% for regular soda.
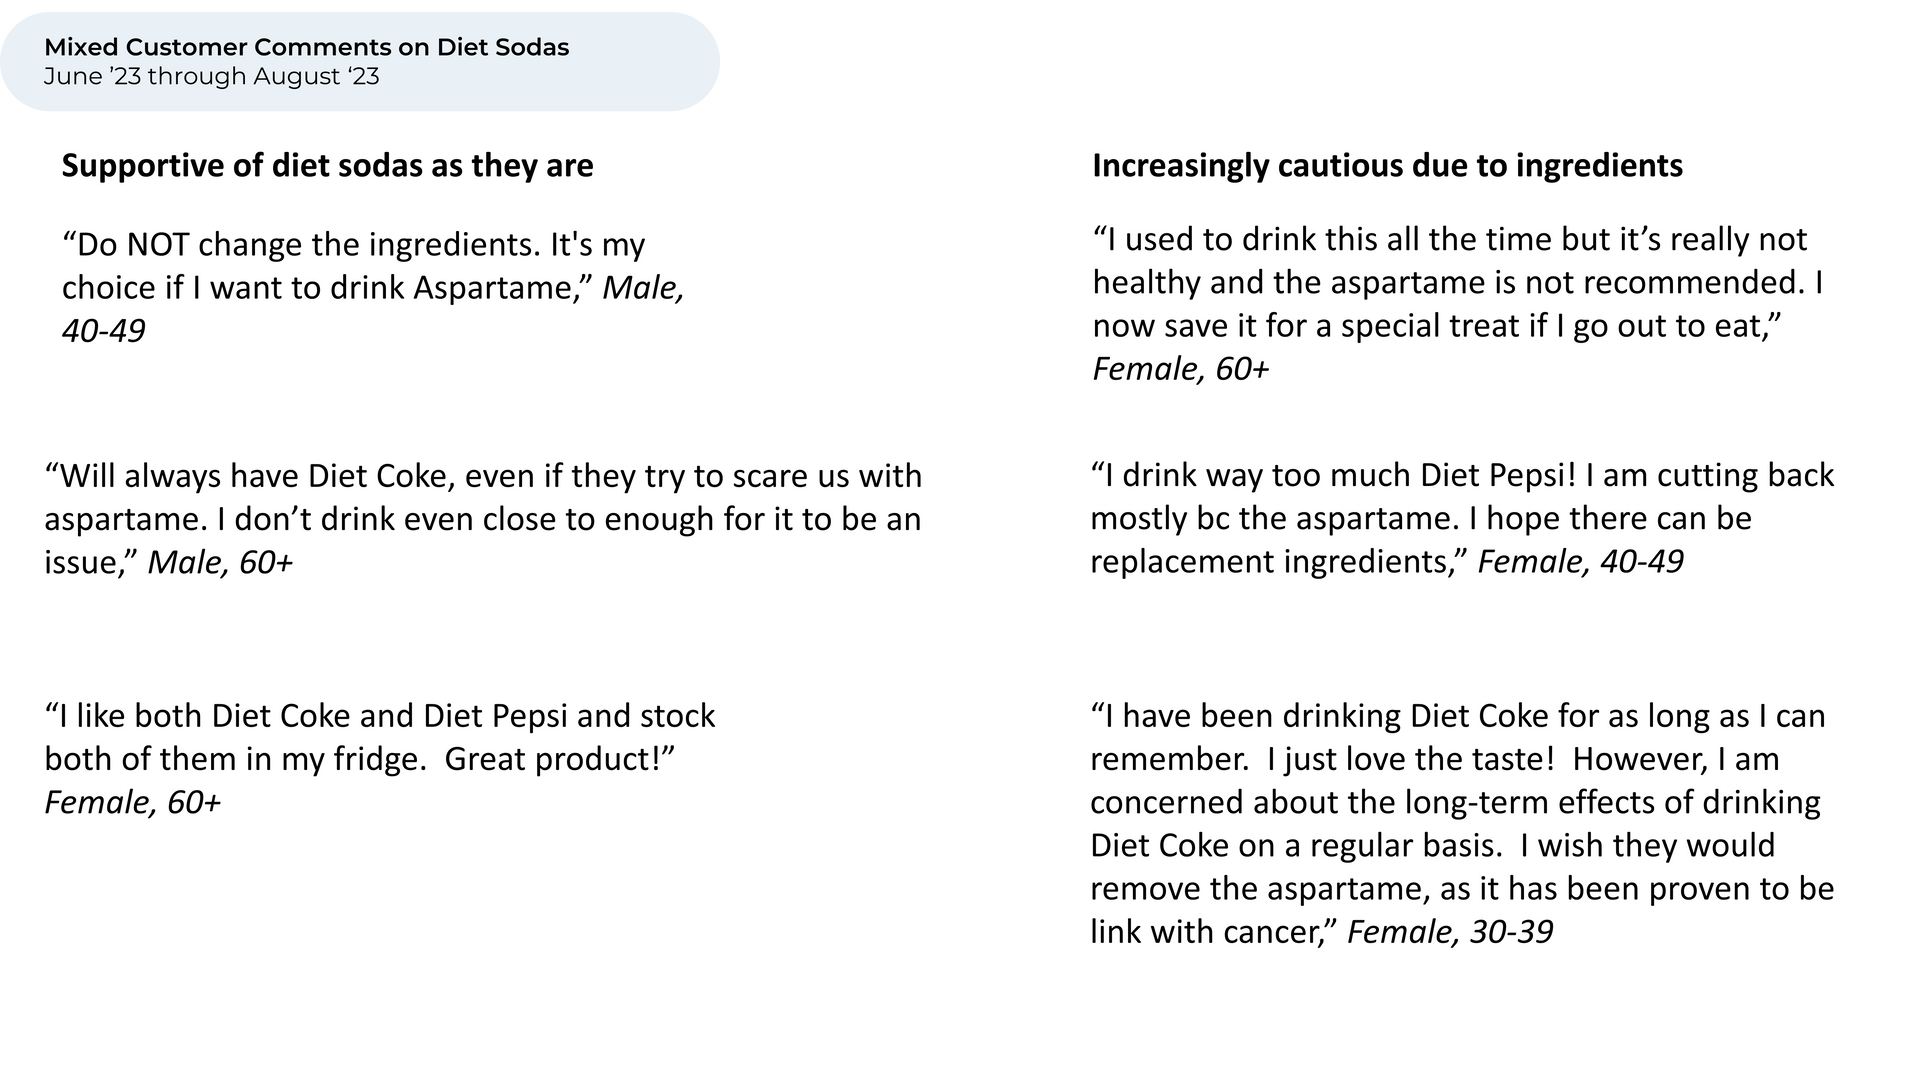
- Recent customer comments are mixed on aspartame. Over the past few months, many diet soda drinkers have expressed concern over aspartame, but a few have said they don’t want companies to find a new ingredient and say drinking it is their choice.
Discover HundredX insights into Beverage Trends:
Please contact our team for a deeper look at HundredX's data on beverages, which includes more than 400,000 pieces of customer feedback across 91 non-alcoholic beverage brands.
- All metrics presented, including Net Consumption Intent (Usage Intent), and Net Favorability / Net Positive Percent are presented on a trailing three-month basis unless otherwise noted.
- Consumption Intent reflects the percentage of customers who plan to consume more of a specific brand during the next 12 months, minus the percentage who plan to consume less. We find businesses that see customer Intent trends gain versus the industry have often seen revenue growth rates, margins and/or market share also improve versus peers.
- HundredX measures net favorability toward a driver of customer satisfaction as Net Positive Percent (NPP), which is the percentage of customers who view a factor as a positive (reason they liked the products, people, or experiences) minus the percentage who see the same factor as a negative.
Strategy Made Smarter
HundredX works with a variety of companies and their investors to answer some of the most important strategy questions in business:
- Where are customers "migrating"?
- What are they saying they will use more of in the next 12 months?
- What are the key drivers of their purchase decisions and financial outcomes?
Current clients see immediate benefits across multiple areas including strategy, finance, operations, pricing, investing, and marketing.
Our insights enable business leaders to define and identify specific drivers and decisions enabling them to grow their market share.
Please contact our team to learn more about which businesses across 75 industries are best positioned with customers and the decisions you can make to grow your brand’s market share.
####
HundredX is a mission-based data and insights provider. HundredX does not make investment recommendations. However, we believe in the wisdom of the crowd to inform the outlook for businesses and industries. For more info on specific drivers of customer satisfaction, other companies within 75+ other industries we cover, or if you'd like to learn more about using Data for Good, please reach out: https://hundredx.com/contact.
Share This Article