As the curtains draw to a close on this chapter for Bed Bath & Beyond (BBB), Purchase Intent data sheds light on the retailer's struggles to keep pace with its competitors in the Home & Furnishings industry. The steady decline over the past six months revealed a worrying trend for the company, while other brands managed to maintain or even grow their market share.
By making smart investments to target customers who fit the demographic profile and preferences of BBB's customers, competitors like JC Penny, Kohl's, Macy's, and Target may be poised to scoop up these shoppers should they look for alternatives. Analyzing more than 330,000 pieces of feedback from “The Crowd” of department store, fashion, e-commerce, and home & furnishing shoppers, HundredX finds:
- BBB had the biggest drop and lowest level of Purchase Intent¹,² of its peer group. It began a drop from close to average last summer, accelerating to fall 10% over the past six months.
- Macy’s appears best positioned to gain share based on the mix of overlaps discussed below.
- BBB’s Net Promoter Score® (loyalty indicator)³ is most above average for shoppers making less than $50K per year and customers over 50 years old. Its Purchase Intent (growth indicator) is most above average with shoppers in the same income range but in their thirties.
- BBB’s biggest advantages over other home & furnishings brands are pleasing its customers with the brands and quality of products it carries. Companies already doing well in these areas that might gain BBB customers include Macy’s, Williams Sonoma, and Target.
- Of these competitors, Macy’s is the one that also has strong overlaps on age and income customer profiles. JC Penny, Kohl’s, Ikea and Walmart overlap on age and income, but not on customer sentiment⁴ towards their brands or quality of products carried.
- Macy’s, Kohl’s, and Target were also top of mind for a significant amount (34% to 60%) of customers sharing feedback on BBB.
Over the past six months, Purchase Intent from the Crowd has painted a stark contrast between the growth outlook for BBB and some of its biggest competitors within the Home & Furnishings industry. While the overall industry experienced a 3% decline in Purchase Intent from September 2022 through March 2023, BBB's drop was far more pronounced, ultimately foreshadowing the company's eventual bankruptcy filing on April 23.
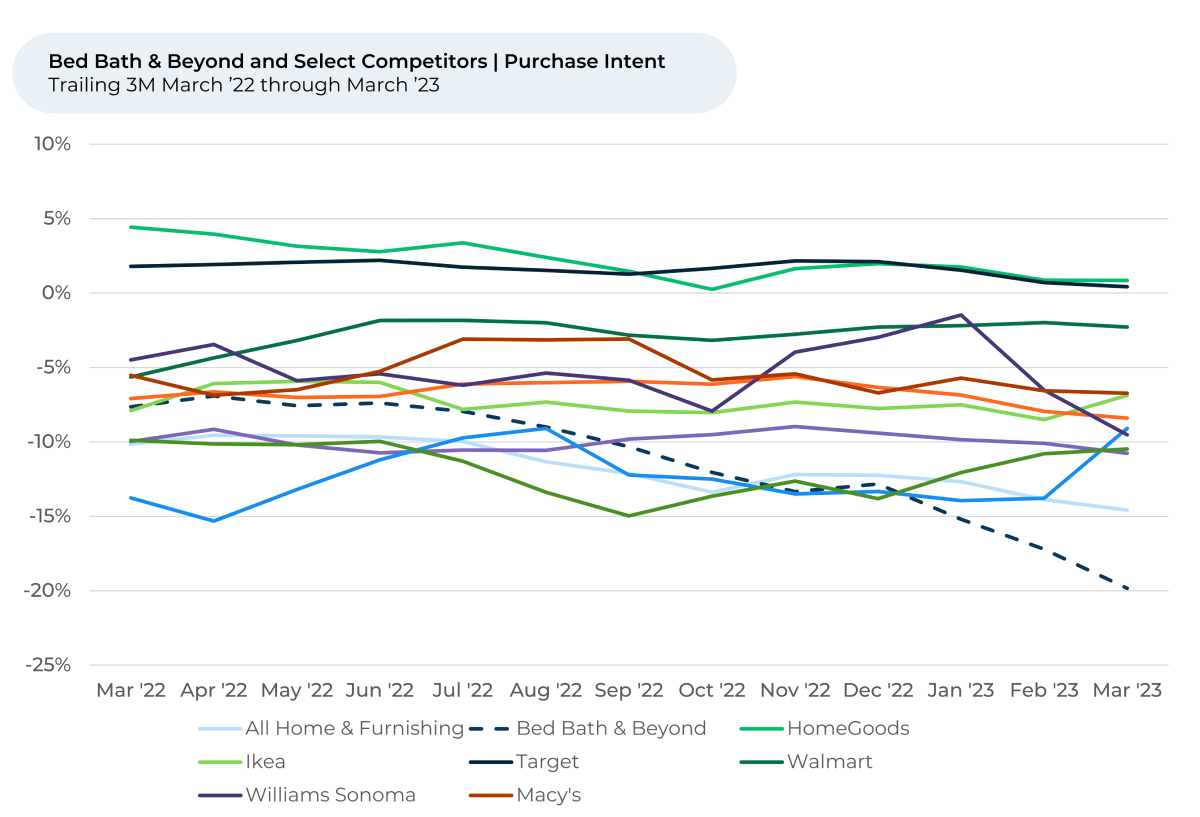
BBB's Purchase Intent slid drastically from -10% to -20%, indicating waning customer interest. Even as it fell, Purchase Intent increased for a few of BBB’s competitors. It rose 3% - 5% for online retailers Wayfair and Overstock.com, and 1% for retail giants Ikea and Walmart. Purchase Intent stayed relatively stable for HomeGoods and Target.
This significant discrepancy between BBB and its competitors signals the extent to which the company lagged in the market. The sharp decline in Purchase Intent coincided with a 33% drop in BBB’s most recently reported net sales for Q3 2022 (ended November 26, 2022, reported January 10, 2023) compared to the year before.
According to the retailer, the drop reflected factors including “lower customer traffic and reduced levels of inventory availability.”
Bed Bath & Beyond positioned strongest with lower income, middle-age and Hispanic customers
As BBB evaluates whether to reduce investments or wind down parts of its business, its customers may look for other places to shop. So, we look at the retailer’s customer base to identify opportunities for competitors.
We’ve found BBB’s Net Promoter Score (NPS®), an indicator of which groups are the strongest / core customers, is significantly higher than its 13% overall average for Hispanic/Latino shoppers (34%), those making less than $25K per year (26%) and customers in their fifties (22%). NPS® for people making $25K-$50K was close (24%), as was people 60+ years old (20%). All other groups by race, age and income were at least 7-15% lower than these.
Interestingly, the patterns for NPS® for the Home & Furnishings industry overall are similar. Industry NPS® is highest for Hispanic/Latino shoppers (39%), people making less than $25K per year (32%) and customers who are 60+ years old (35%). BBB’s NPS® lags the industry in every demographic.
For insight into where the highest growth potential lies for other stores looking to take its former customers, we’ve found BBB Purchase Intent is significantly higher than the -20% overall average for Hispanic/Latino shoppers (-14%), customers in their thirties (-15%) and those making less than $25K and $25K-$50K per year (both -16%). All other groups by race, age and income were at least 3%-5% lower than these. Purchase intent fell in order of household income, with customers making $50K-$100K per year the next highest and lowest overall for those making $200K or more.
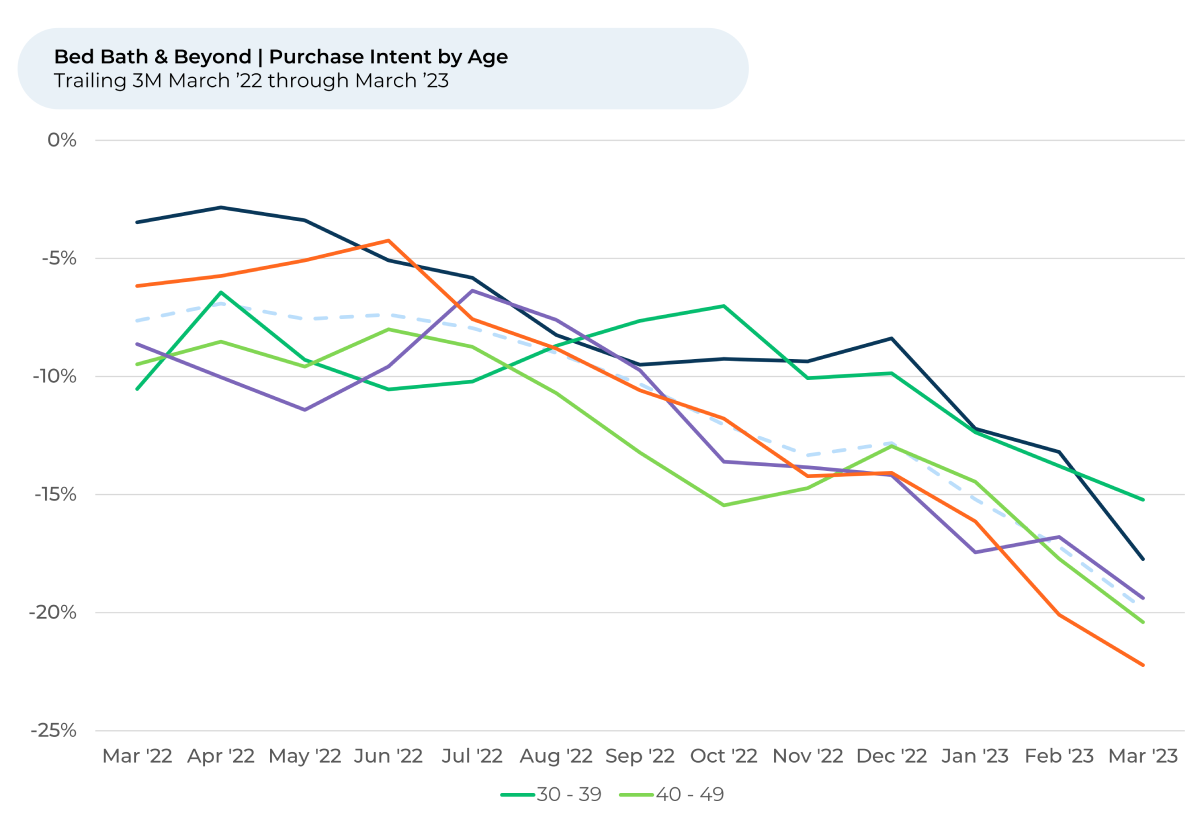
The same isn’t true for the Home & Furnishing industry and other competitors as whole, which sees Purchase Intent highest for African-American shoppers, customers aged 18-29 and those making $200K or more per year. Only JC Penny and Kohl’s see Purchase Intent highest for customers in their thirties. Ikea, Walmart, JC Penney and Macy’s all have Purchase Intent highest for customers making $50K or less per year. Compared to competitors, these companies may have an easier time winning over BBB’s customers in their thirties and those that make less money.
BBB was most loved for the brands and quality of products it carried
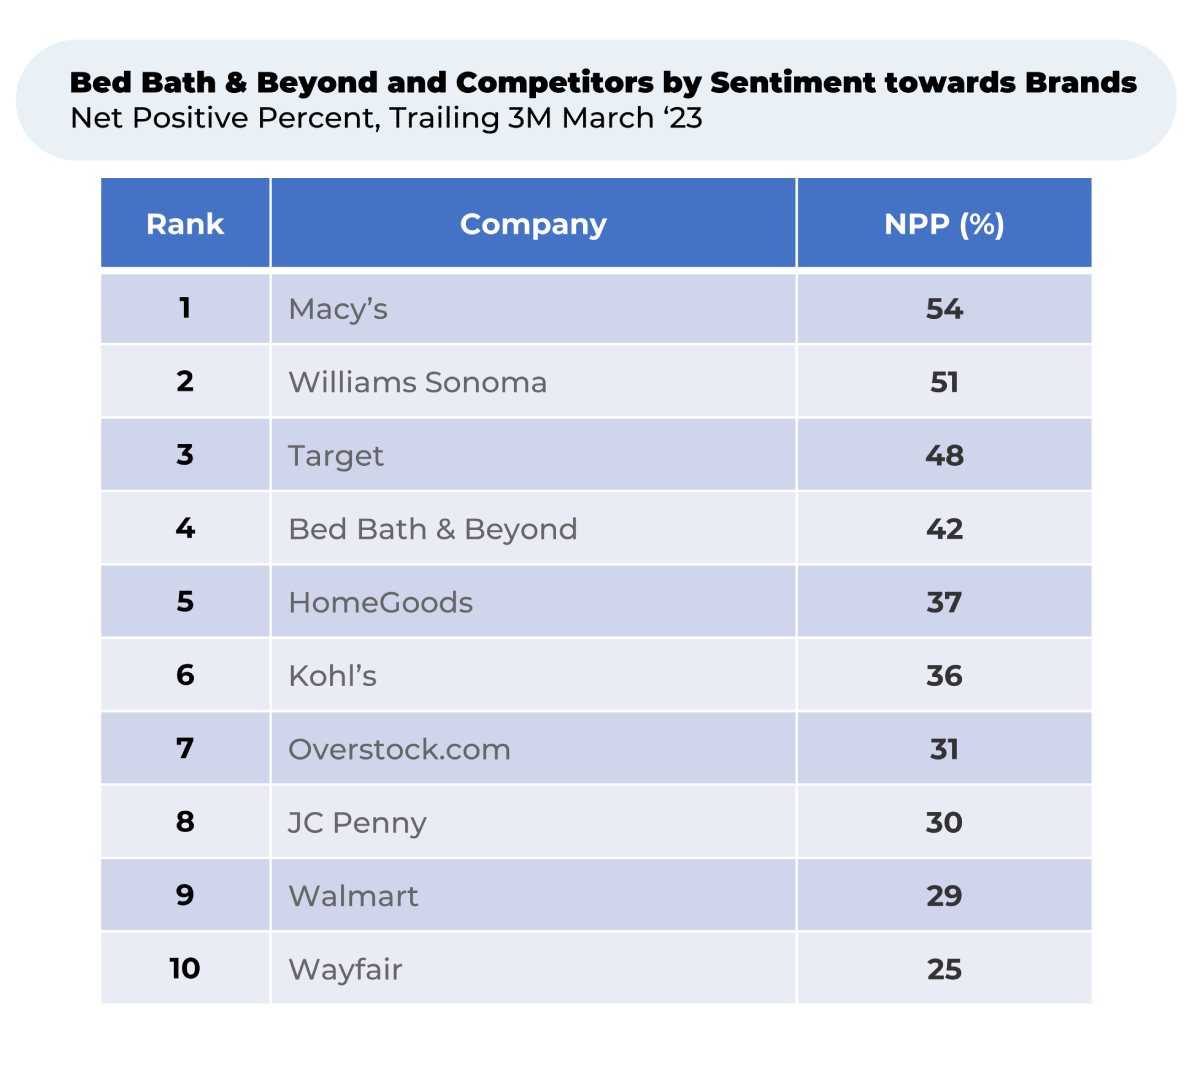
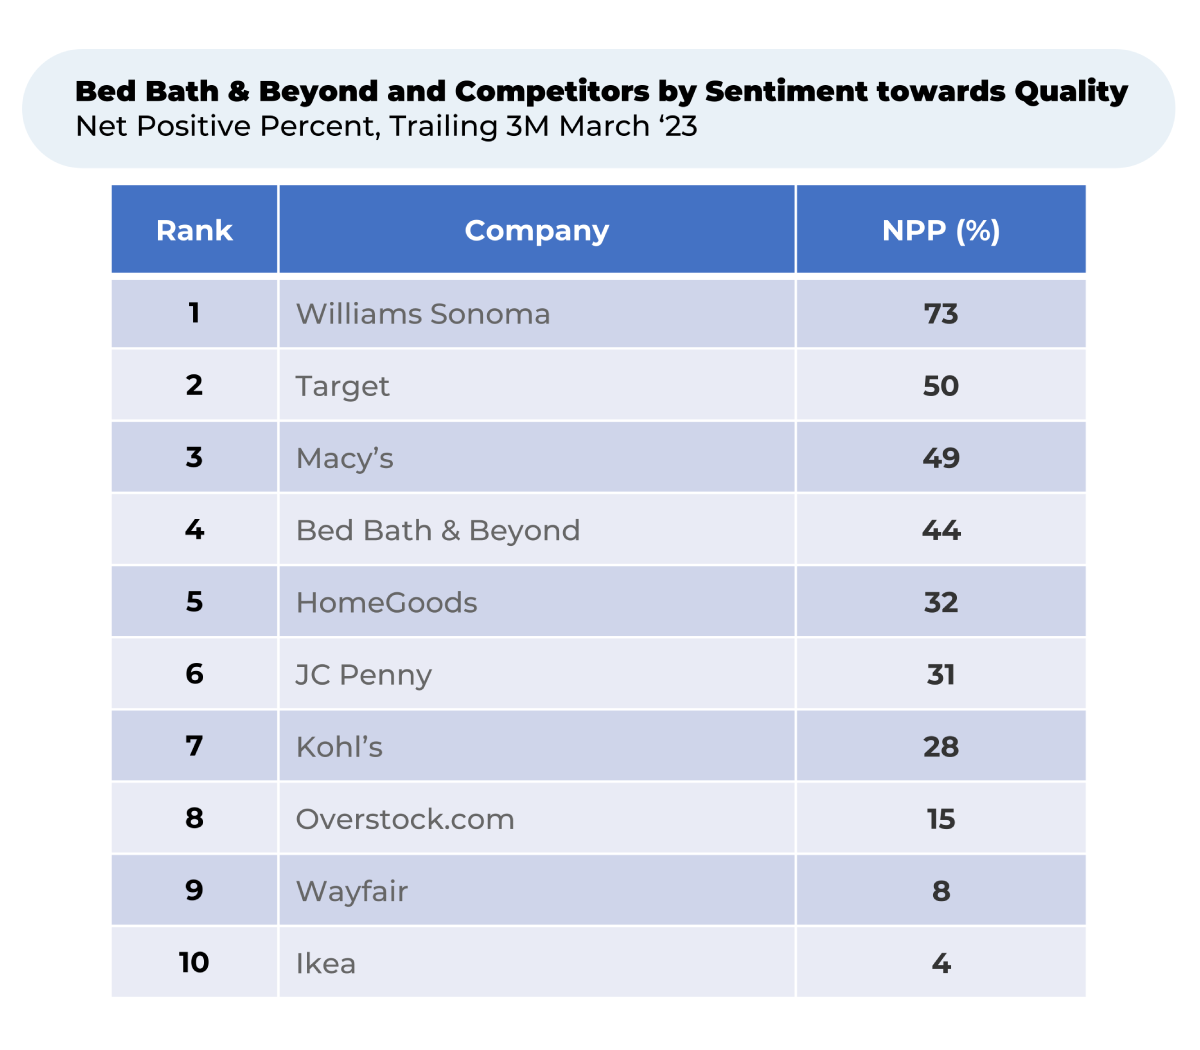
While we found customers generally liked a number of aspects of BBB, the retailer managed to especially please its customers with the brands it offered and the quality of its products. Customer sentiment towards brands is 15% higher than the Home & Furnishings industry average, while sentiment towards quality is 13% higher.
With sentiment ranging between 48% - 54%, Macy’s, Williams Sonoma, and Target please their customers more with their brands than BBB does. Macy’s owns more than 20 brands, Target has around 50. Williams Sonoma owns several well-known, higher-end brands, including Pottery Barn, West Elm, and Mark and Graham. All the other retailers listed below sell dozens, or hundreds, more brands.
Williams Sonoma, Target, and Macy’s all please their customers more than BBB with the quality of their products. Williams Sonoma, with sentiment at 73%, has particularly happy shoppers. That’s no surprise – the retailer is known for its high-quality (and expensive) brands like All-Clad, Le Creuset, and its own Williams Sonoma brand.
By appealing BBB customers looking for quality products and good brands, Target, Macy’s, and Williams Sonoma could take the market share the bankrupt retailer may leave behind. Fortunately for them, they may not have to try very hard.
About 60% of HundredX respondents leaving feedback for BBB also leave feedback for Target, implying it is top of mind with the majority of BBB customers. In fact, more BBB shoppers also leave feedback on Target than for any other store.
Other competitors that are top of mind for BBB customers include Walmart (59% of BBB customers), Kohl’s (44%), Macy’s (34%) and JC Penny (27%).
As shoppers potentially search for new retail options, we will see how much Macy’s, JC Penny and other competitors that cater to BBB's customer base (particularly in terms of quality and brand offerings) can benefit the most from the shifting landscape.
- All metrics presented, including Net Purchase Intent (Purchase Intent), and Net Positive Percent / Sentiment are presented on a trailing three-month basis unless otherwise noted.
- Purchase Intent for retail subsectors represents the percentage of customers who expect to spend more with that brand over the next 12 months, minus those that intend to spend less.
- Net Promoter Score® (NPS®) measures a customer’s wiliness to recommend a given brand to a friend, on a scale of 1 to 10. The metric represents the percentage of customers who are promoters (answering 9 or 10) minus the percentage who are detractors (answering 6 or less). NPS® is a registered trademark of Bain & Company, Inc., NICE Systems, Inc., and Fred Reichheld.
- HundredX measures sentiment towards a driver of customer satisfaction as Net Positive Percent (NPP), which is the percentage of customers who view a factor as a positive (reason they liked the products, people, or experiences) minus the percentage who see the same factor as a negative.
Strategy Made Smarter
HundredX works with a variety of companies and their investors to answer some of the most important strategy questions in business:
- Where are customers "migrating"?
- What are they saying they will use more of in the next 12 months?
- What are the key drivers of their purchase decisions and financial outcomes?
Current clients see immediate benefits across multiple areas including strategy, finance, operations, pricing, investing, and marketing.
Our insights enable business leaders to define and identify specific drivers and decisions enabling them to grow their market share.
Please contact our team to learn more about which businesses across 75 industries are best positioned with customers and the decisions you can make to grow your brand’s market share.
####
HundredX is a mission-based data and insights provider. HundredX does not make investment recommendations. However, we believe in the wisdom of the crowd to inform the outlook for businesses and industries. For more info on specific drivers of customer satisfaction, other companies within 75+ other industries we cover, or if you'd like to learn more about using Data for Good, please reach out: https://hundredx.com/contact.

