Less cheer for the holidays this season?
As we approach one of the busiest times of the year for beverage sales, we look at current drinking trends, which age groups plan to consume more vs. less alcoholic beverages, and which brands appeal the most by age.
“The Crowd,” real consumers that purchase and drink a variety of beverages, and who share immediate feedback with HundredX, indicates that:
- Growth in US alcohol consumption will likely remain stable or slow modestly during the coming months. Net Purchase Intent for Alcoholic Beverages has been relatively stable over the last year, but has declined slightly over the last few months.
- The 30-39 cohort is the only group that says it intends to drink more alcohol.
- The 18-29-cohort intends to drink much less alcohol.
Collected from thousands of real customers and 290,000+ data points on beverage brands, Net Purchase Intent (NPI) directly indicates consumers’ future drinking plans. NPI measures the percentage of consumers who plan to drink more over the next 12 months minus the percentage that intends to drink less. For both Beverages and Alcohol, we observe continued, declining NPI.
NPI for Alcohol Beverages across all age groups is up year-over-year but has been declining modestly during the last few months. We believe this indicates growth in US alcohol consumption, as measured by the Retail Sales collected by the US Census Bureau, will likely be stable or slow modestly in the coming months. Retail sales YTD through August 2022 was up just under 1% vs. YTD August 2021, though the monthly growth figures have been volatile ― between -2% and +3%.
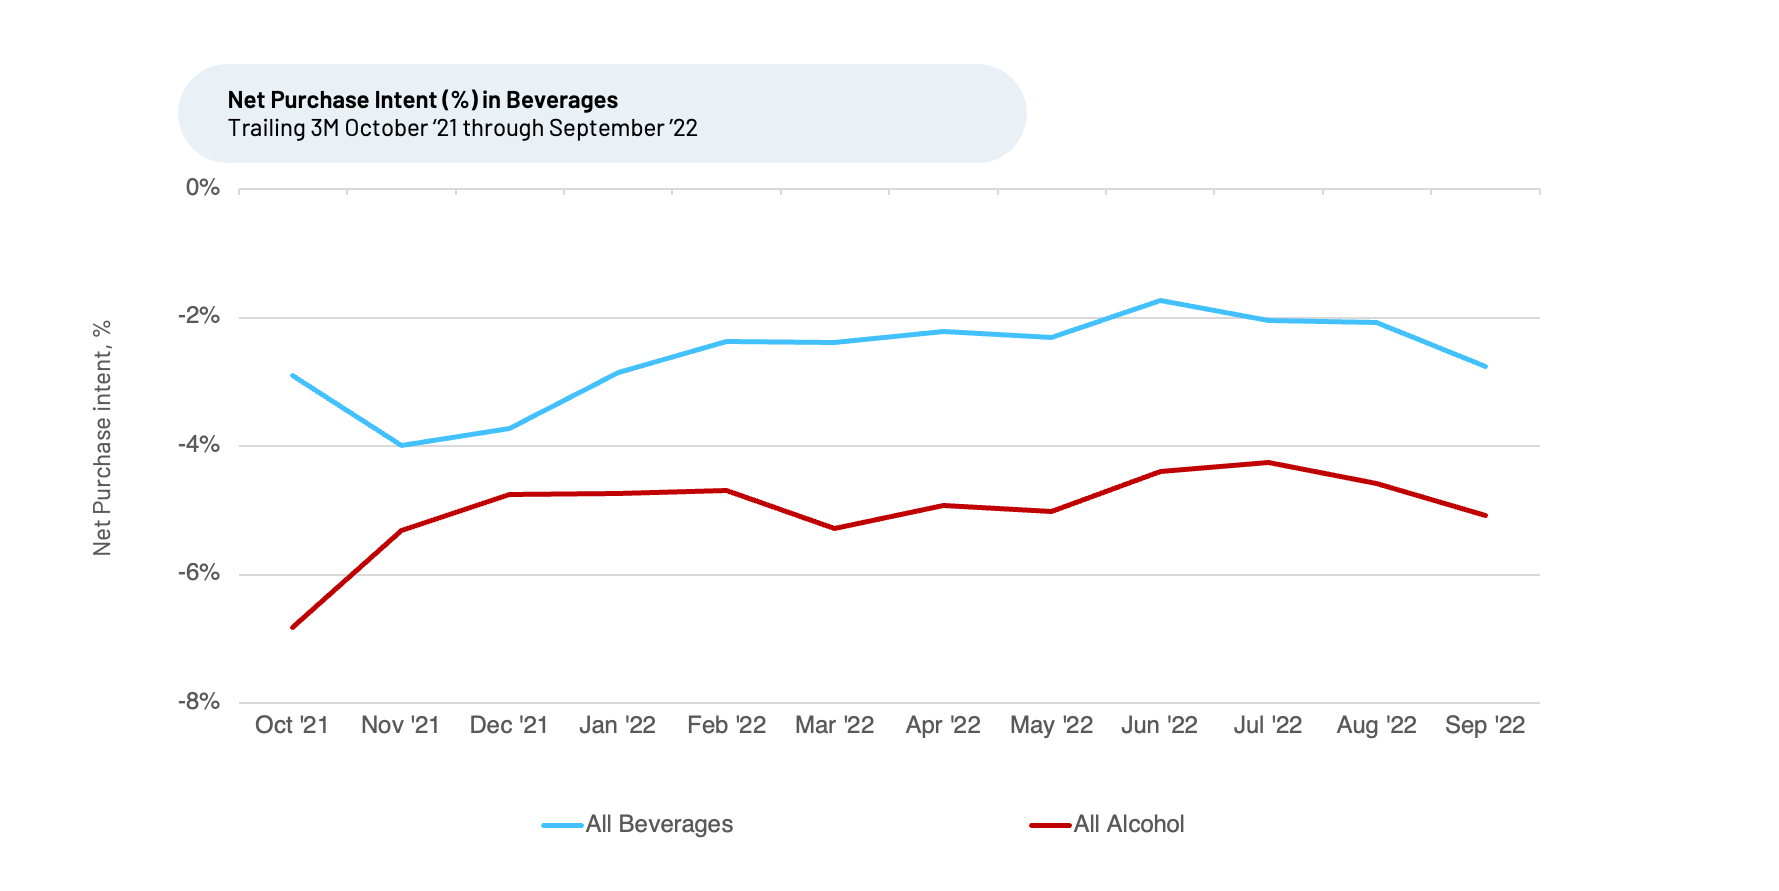
We note, NPI for Alcoholic Beverages is lower than it is for Beverages overall, with the gap wider today than it was a year ago. When we observe this widening gap in NPI growth rates for other companies or industries, it generally indicates a loss in market share and a weaker relative growth rate for the one with lower NPI. We take a closer look at Alcoholic Beverages to better understand the factors driving this trend, including consumption intentions that should inform expected growth in brands and types of alcohol among different age groups.
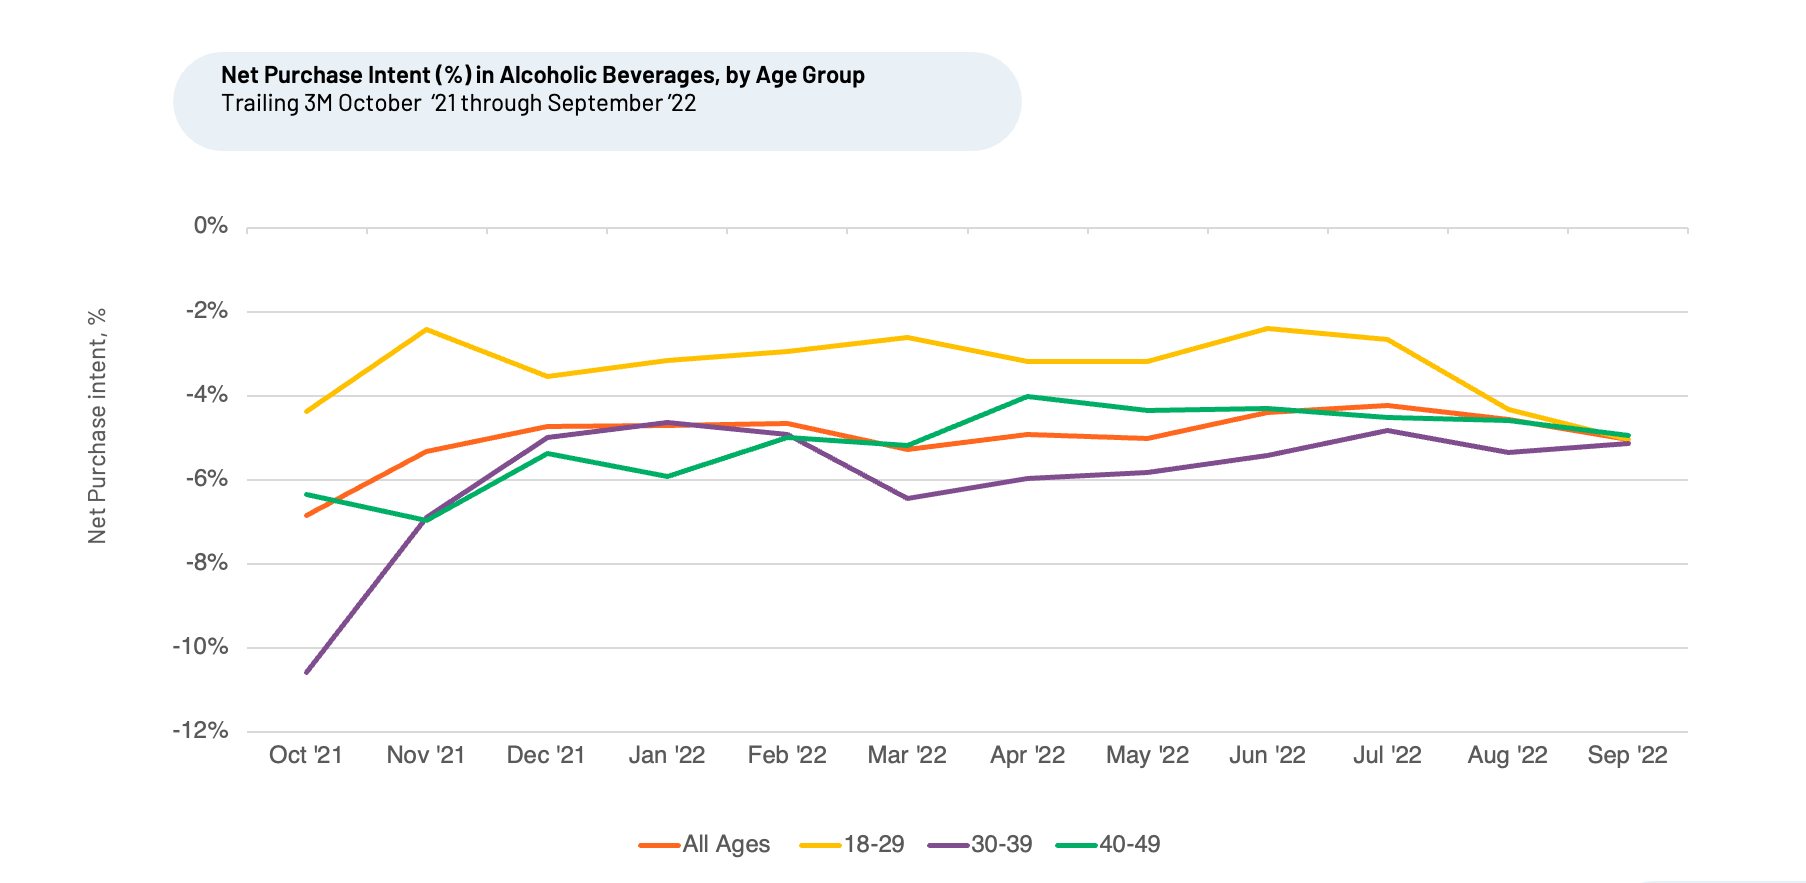
Based on HundredX future consumption intent data, we see that 18-29 year-olds’ interest has declined since July 2022 and is down versus a year ago. 40-49 year-olds intend to drink less as well, with NPI down more modestly since April 2022, but still up slightly versus a year ago. The 30-39 year-old cohort intends to drink more, and this trend has maintained a steady upward rate since March 2022 and is up more significantly versus a year ago.
We next look at what alcohol brands consumers favor and intend to drink more of in the future. Within each age group we see much variety and differences.
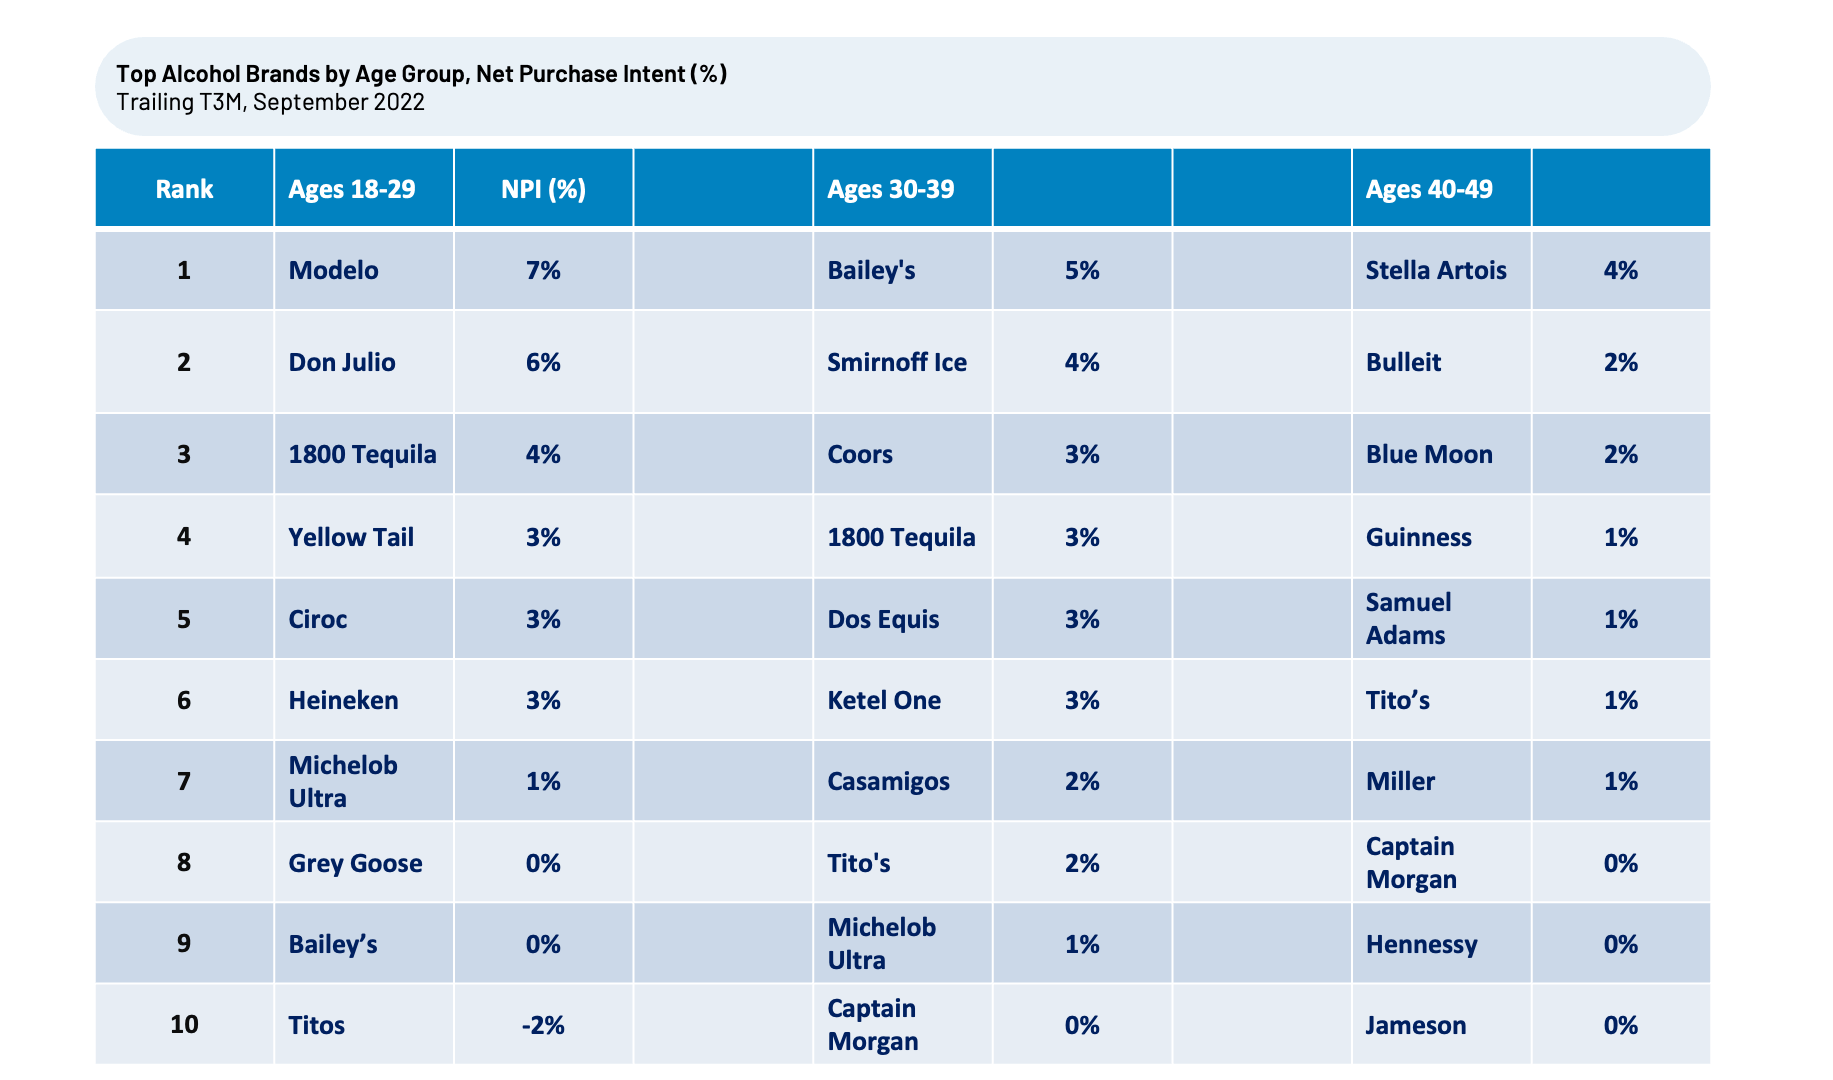
Age 18-29, intend to drink lighter, relatively "healthier" drinks
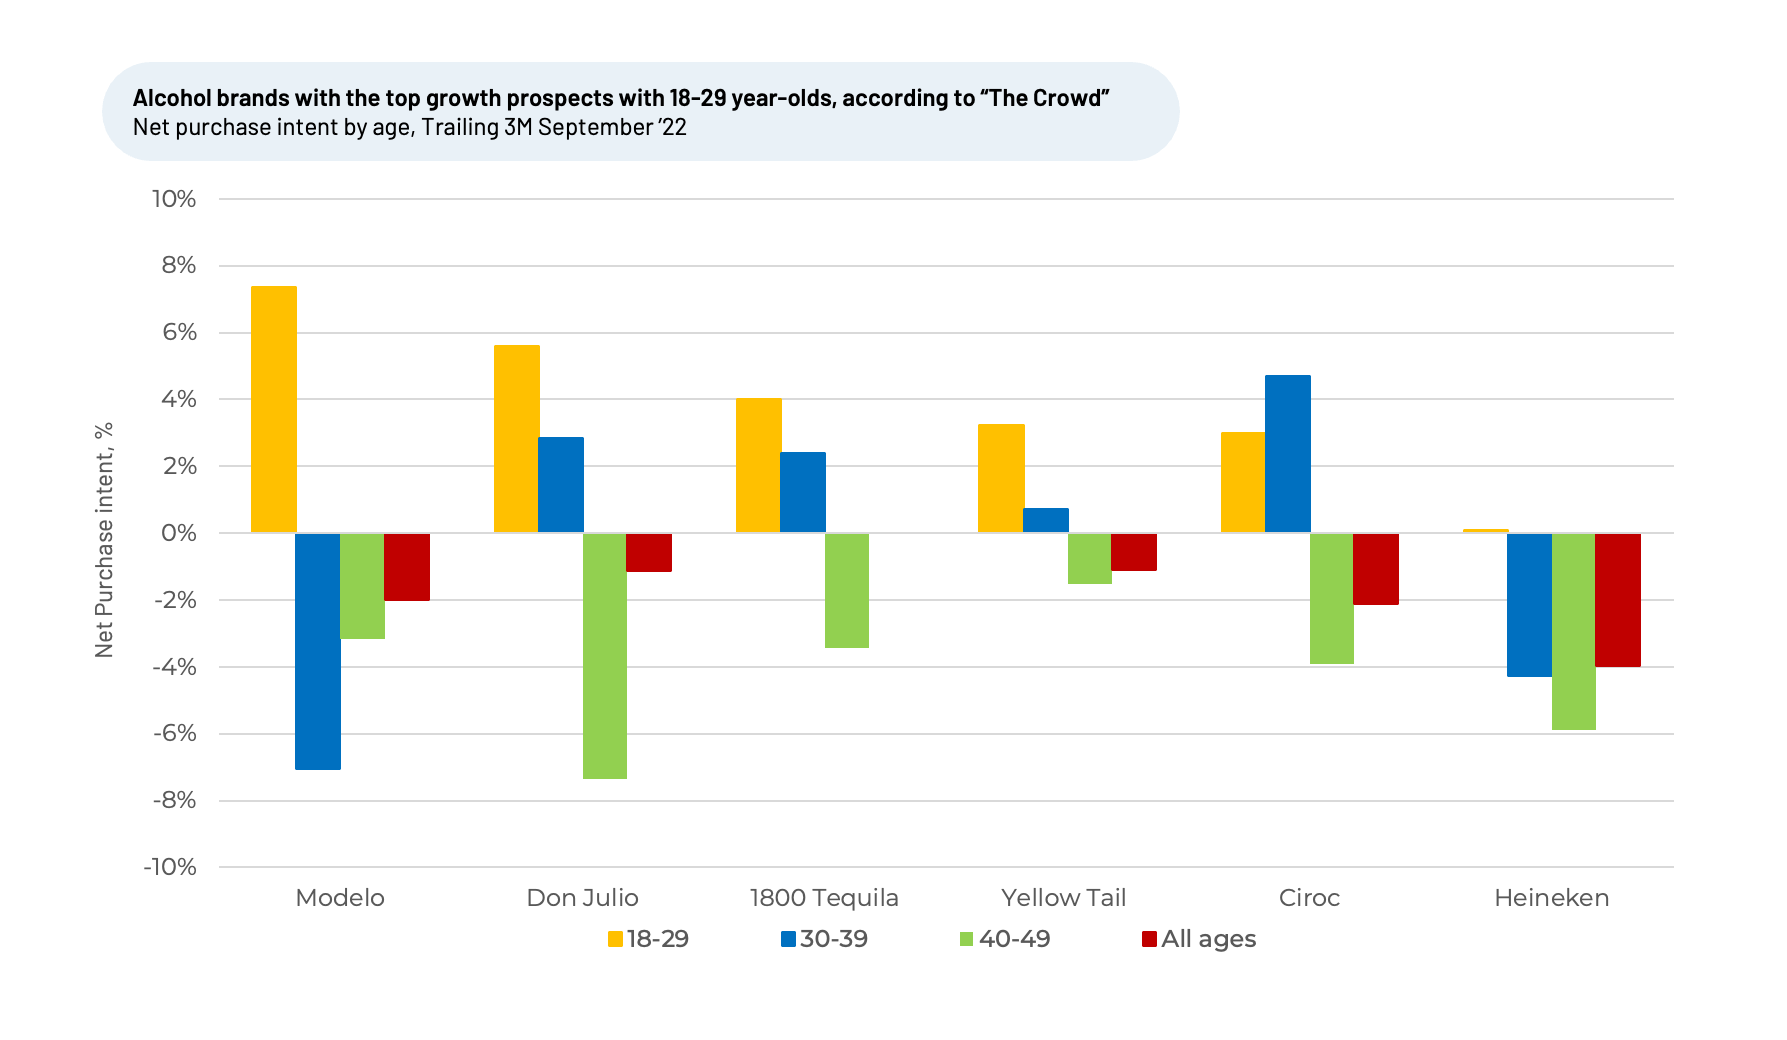
GenZ and slightly older, becoming known as the “sober generation,” favors lighter beers (Modelo and Michelob Ultra are low calorie beers), tequila, and wine, indicating growth for those brands and categories should be strongest in the coming months. Looking at the underlying customer satisfaction drivers, we see “Health-Conscious Choices” has been rising very slowly but steadily in terms of the percentage of times it is selected as important since late last year and that percentage both has risen faster and is higher for 18-29 than 30-39 and 40-49 year-olds.
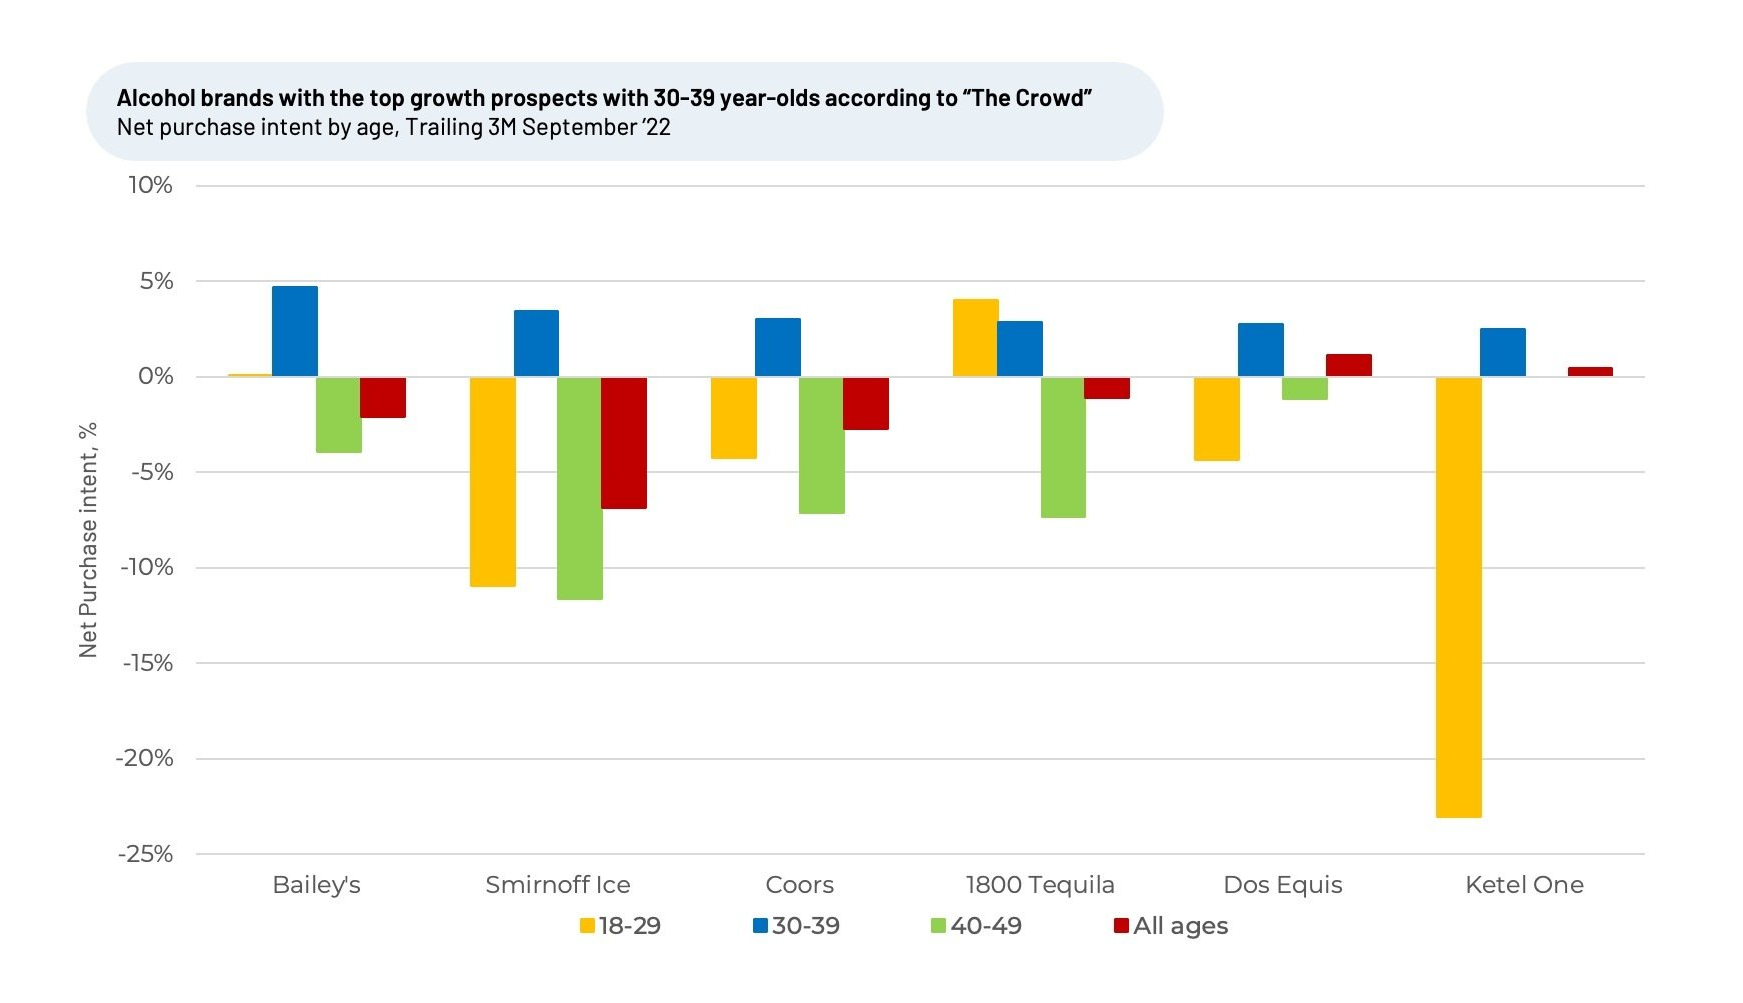
Ages 30-39, intends to drink more of a range of alcohol types
This group intends to drink more of a wide mix of different drinks, ranging from tequila and vodka to flavored drinks and beer.
New Ages 40-49, plan to drink less overall, but consume more beer and brown liquor
Purchase intent data indicates this group expects to drink more beer and brown liquor such as whiskey and rum.

To learn more about the brands dominating our broader Alcoholic Beverage coverage, and for specific details insights on the 50-60+ age group, please contact us.
Strategy Made Smarter
HundredX works with a variety of companies and their investors to answer some of the most important strategy questions in business:
- Where are customers "migrating"?
- What are they saying they will use more of in the next 12 months?
- What are the key drivers of their purchase decisions and financial outcomes?
Current clients see immediate benefits across multiple areas including strategy, finance, operations, pricing, investing, and marketing.
Our insights enable business leaders to define and identify specific drivers and decisions enabling them to grow their market share.
Please contact our team to learn more about which businesses across 75 industries are best positioned with customers and the decisions you can make to grow your brand’s market share.
####
HundredX is a mission-based data and insights provider and does not make investment recommendations. We believe in the wisdom of "the Crowd" to inform the outlook for businesses and industries. For more information on specific drivers of customer satisfaction (the top three for Alcohol Beverages are Taste, followed by Price and Product Availability), other companies within 75+ other industries we cover, or to learn more about using Data for Good, please contact us.


