Athletic and Athleisure appear poised to continue outgrowing apparel industry.
After being one of the clear winners within the broader Apparel, Footwear, and Accessories industry (“Apparel sector”) in 2021, Athletics and Athleisure companies (collectively “A+A”) are navigating a much more complicated landscape in 2022. Last year, the Apparel sector benefited from strong consumer and employment trends and the world reopening. The A+A industry outgrew the broader Apparel sector, benefiting from consumers spending more time at home exercising and seeking out more comfortable clothes to wear while on video meetings.
In 2022 the A+A space is still growing although much slower as it works through macro headwinds like shrinking consumer discretionary spend, return to office mandates, supply chain disruptions that initially caused shortages now becoming excess inventory buildups, and more. Company growth trends against this backdrop have been and will likely continue to be uneven. In their most recently reported results for quarters ended between the end of April and June 2022, Puma and Adidas saw 20%+ comp store growth in the Americas and North America respectively, while Nike and Under Armour had -5% and +1% comp store growth in North American respectively. Market share gains and losses will continue to be driven by each brand's ability to make the right strategic moves against this backdrop. Recent improvements observed in HundredX data for both Athleta and Under Armour indicate each could see investments lead to improved growth outlooks following recent operational challenges and soft organic growth in North America. The data also indicates Puma's investments leading to an improvement in its competitive positioning and should benefit market share over the next twelve months as well.
Indicators from the Crowd
Leveraging HundredX’s proprietary listening methodology, we evaluated almost 150,000 pieces of feedback from real customer experiences with over 120 brands in our Apparel sector coverage from January 2021 through August 2022 for insight into consumers’ future net purchase intent (NPI), the drivers behind changes in intent, and customer satisfaction (CSAT). Within this coverage, we also specifically evaluated 65K pieces of feedback on a peer group of 10 leading “Athletic” and 4 leading “Athleisure” brands (“A+A peer group”) over the same time period.
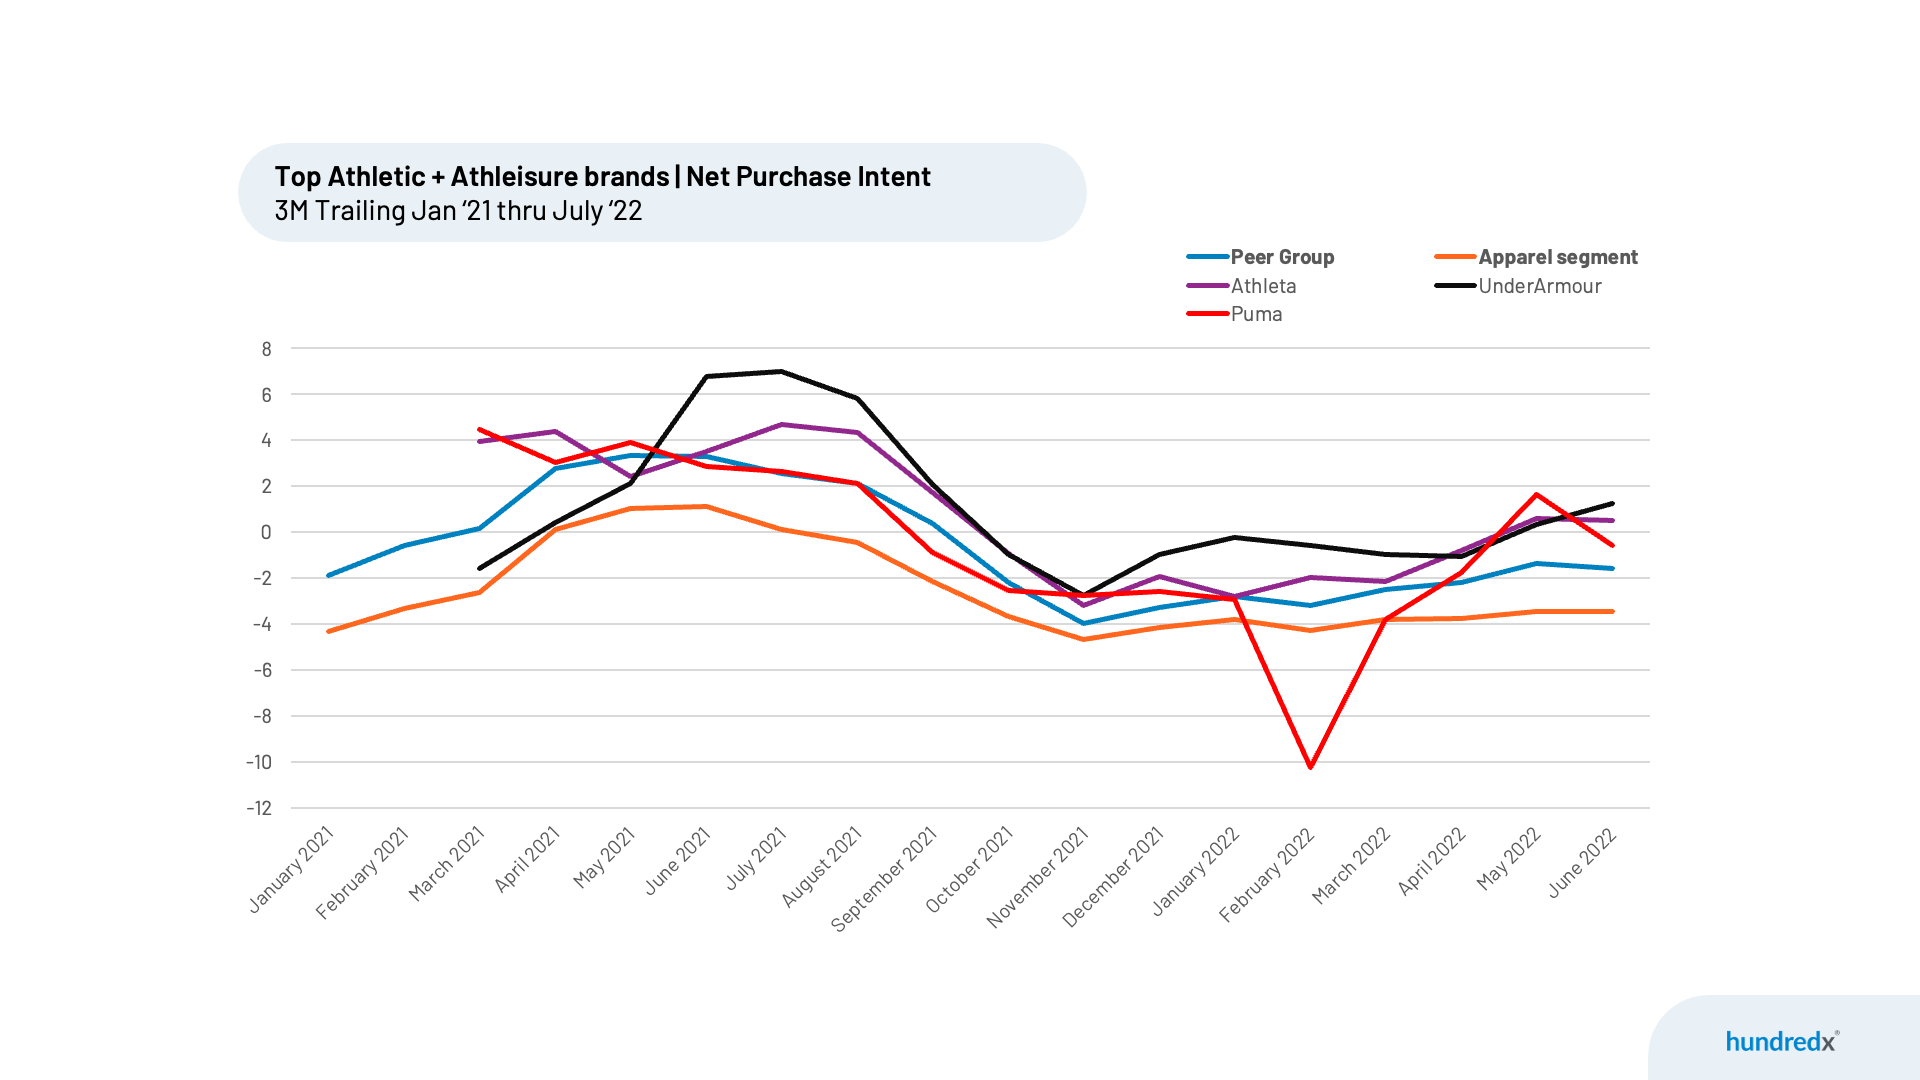
From August 2021 through early 2022, like for most consumer-facing industries, “the Crowd” indicated an impending slowdown in sales growth was on the horizon. Trailing three month (T3M) NPI for both the broader Apparel sector and A+A peers fell by 5% to 6% over that period. NPI reflects the percentage of customers who plan to spend more at a store or on a brand over the next 12 months minus the percentage that plan to buy less.
Over the same time frame, we saw North American organic YoY revenue growth for most of the publicly traded companies in the A+A peer group decelerate from very robust (often triple digit) levels in the spring and summer 2021 to still solid but more modest levels (single digit to teens) since early 2022. The A+A peer group has maintained a stable lead in NPI over the broader Apparel market for the last 18 months, due to all of the favorable trends previously covered.
A Winning Formula for Athletic and Athleisure Brands
While growth for the A+A peer group has remained solid, Athleta and Under Armour in particular stand out as having the strongest NPIs and have seen their leads versus the underlying peer group expand since February/March 2022. This would typically indicate they are poised to sustain higher growth rates and gain market share. The data also shows Puma staged a massive rally in T3M NPI, from lagging the A+A peer group by 7% in February 2022 to now leading by 2% as of July 2022.
We looked to understand why these brands are beating the competition with respect to customer intent to spend more, digging into specific purchase intent drivers to uncover “the why behind the buy”. Our analysis indicates the A+A businesses that have the best Customer Satisfaction (CSAT) tend to do a better job than the peer group at delighting customers on Styles, Price, Quality, and Availability.
Styles
Athleta and Nike are winning with customers in terms of sentiment towards “Styles”. For T3M July 2022, both had NPPs of 68%, well ahead of the A+A peer average of 57%. Their lead has been steady over the last 18 months, with consumer views on this driver generally moving much less than we see for other drivers.
Also notable is the significant recovery Puma has made this year, rallying from a 20% deficit versus the peer group as of January 2022 all the way to parity as of July 2022. The company has been making investments in its portfolio, and the crowd is noticing. One customer commented in their feedback to HundredX, “Love the direction PUMA has taken over the last few years and continues to move towards in style, sustainability, and collabs. The J Cole line was amazing. Some of the recent shoe designs are great.” Another noted, “They are having some new styles with the LaMelo line in their brand now and for the near future. The styles are getting better and better.”

Price
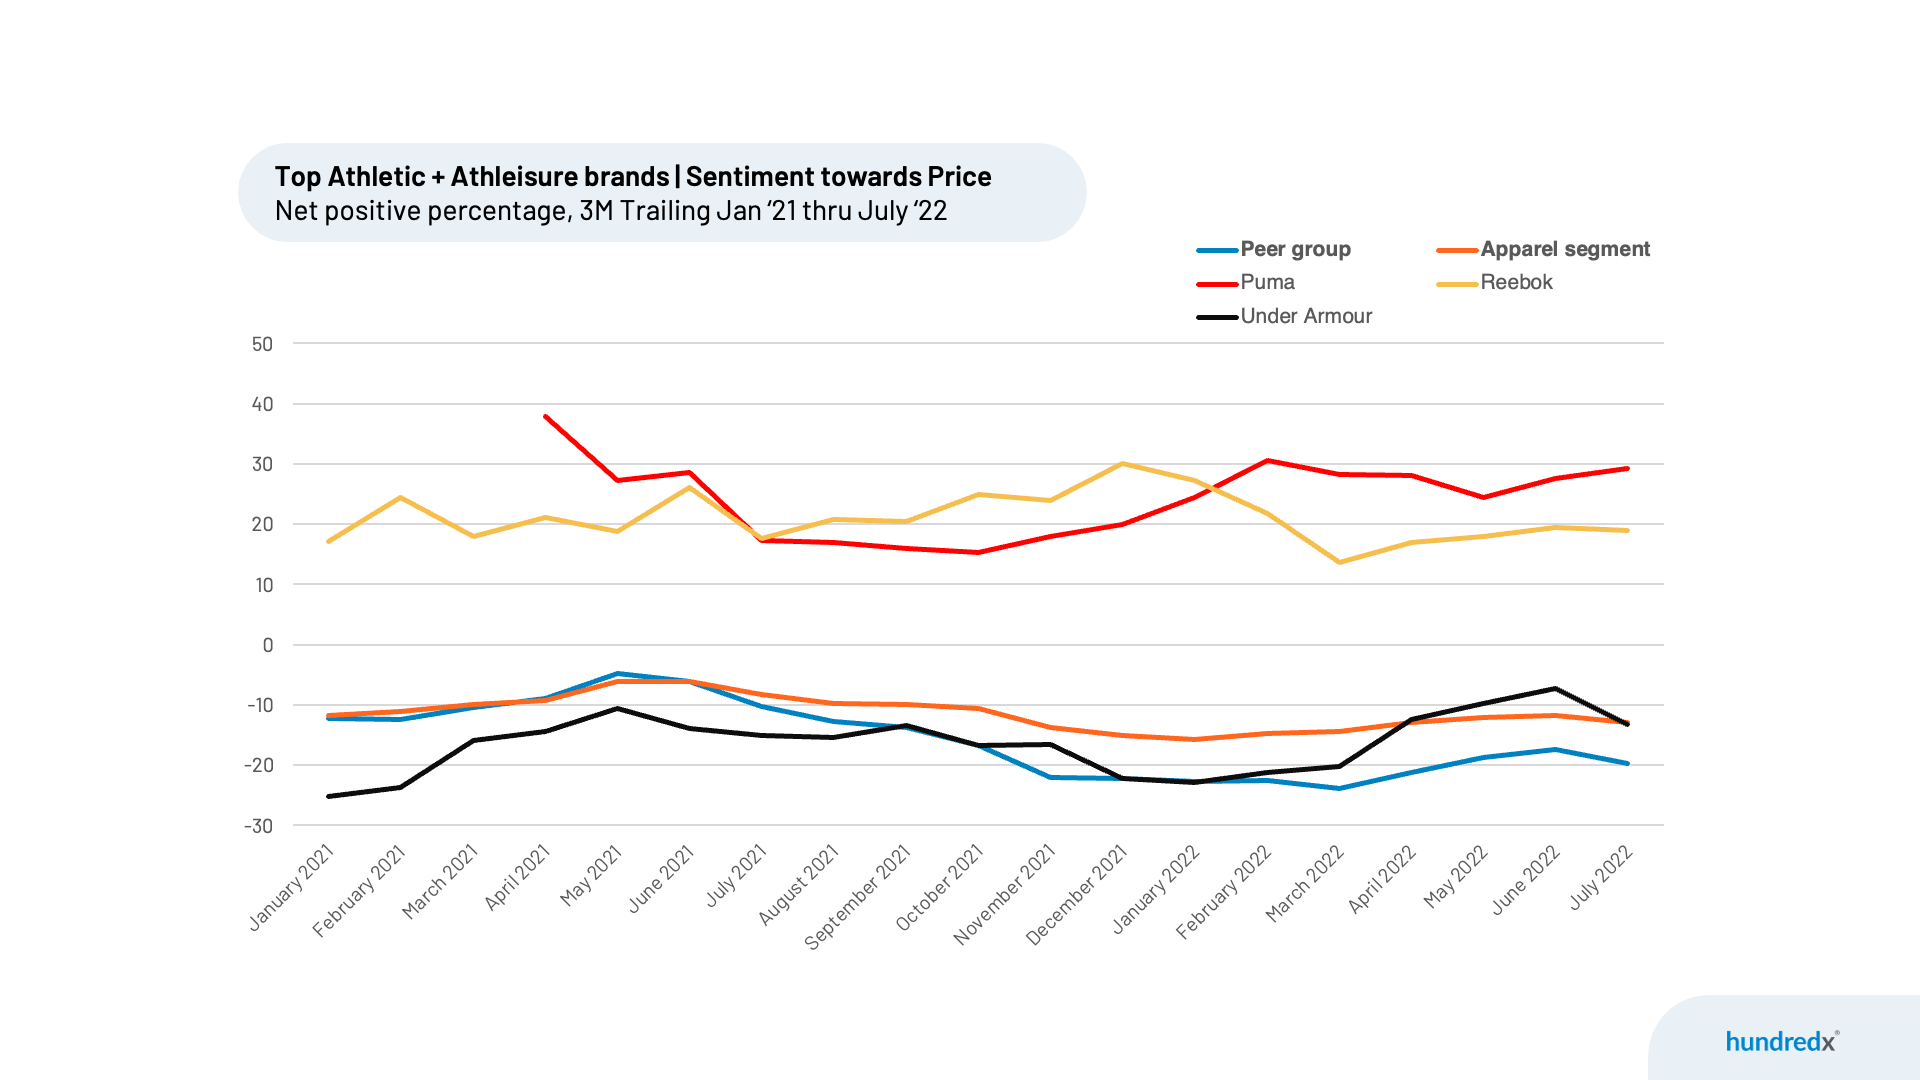
Puma leads in “Price” customer satisfaction with T3M July 2022 NPP of 29%, while Reebok is second with NPP of 19%. Both sustain a massive lead over the peer group average of -20%. Puma apparel and footwear is generally priced more modestly than that of the other major athletic gear companies, and “the Crowd” has noticed. One customer said, “I love Pumas. They are stylish, comfortable and reasonably priced.” Another football (soccer) player shared, “New puma cleats are very comfortable and fit well. The price was unbelievable.”
Interestingly, Under Armour made the biggest jump versus the peer group on price sentiment in the last six months, with its NPP T3M July 2022 rising 9%. It appears Under Armour is being recognized for the elevated amount of promotional activity its management highlighted on its August 2022 earnings call.
Quality
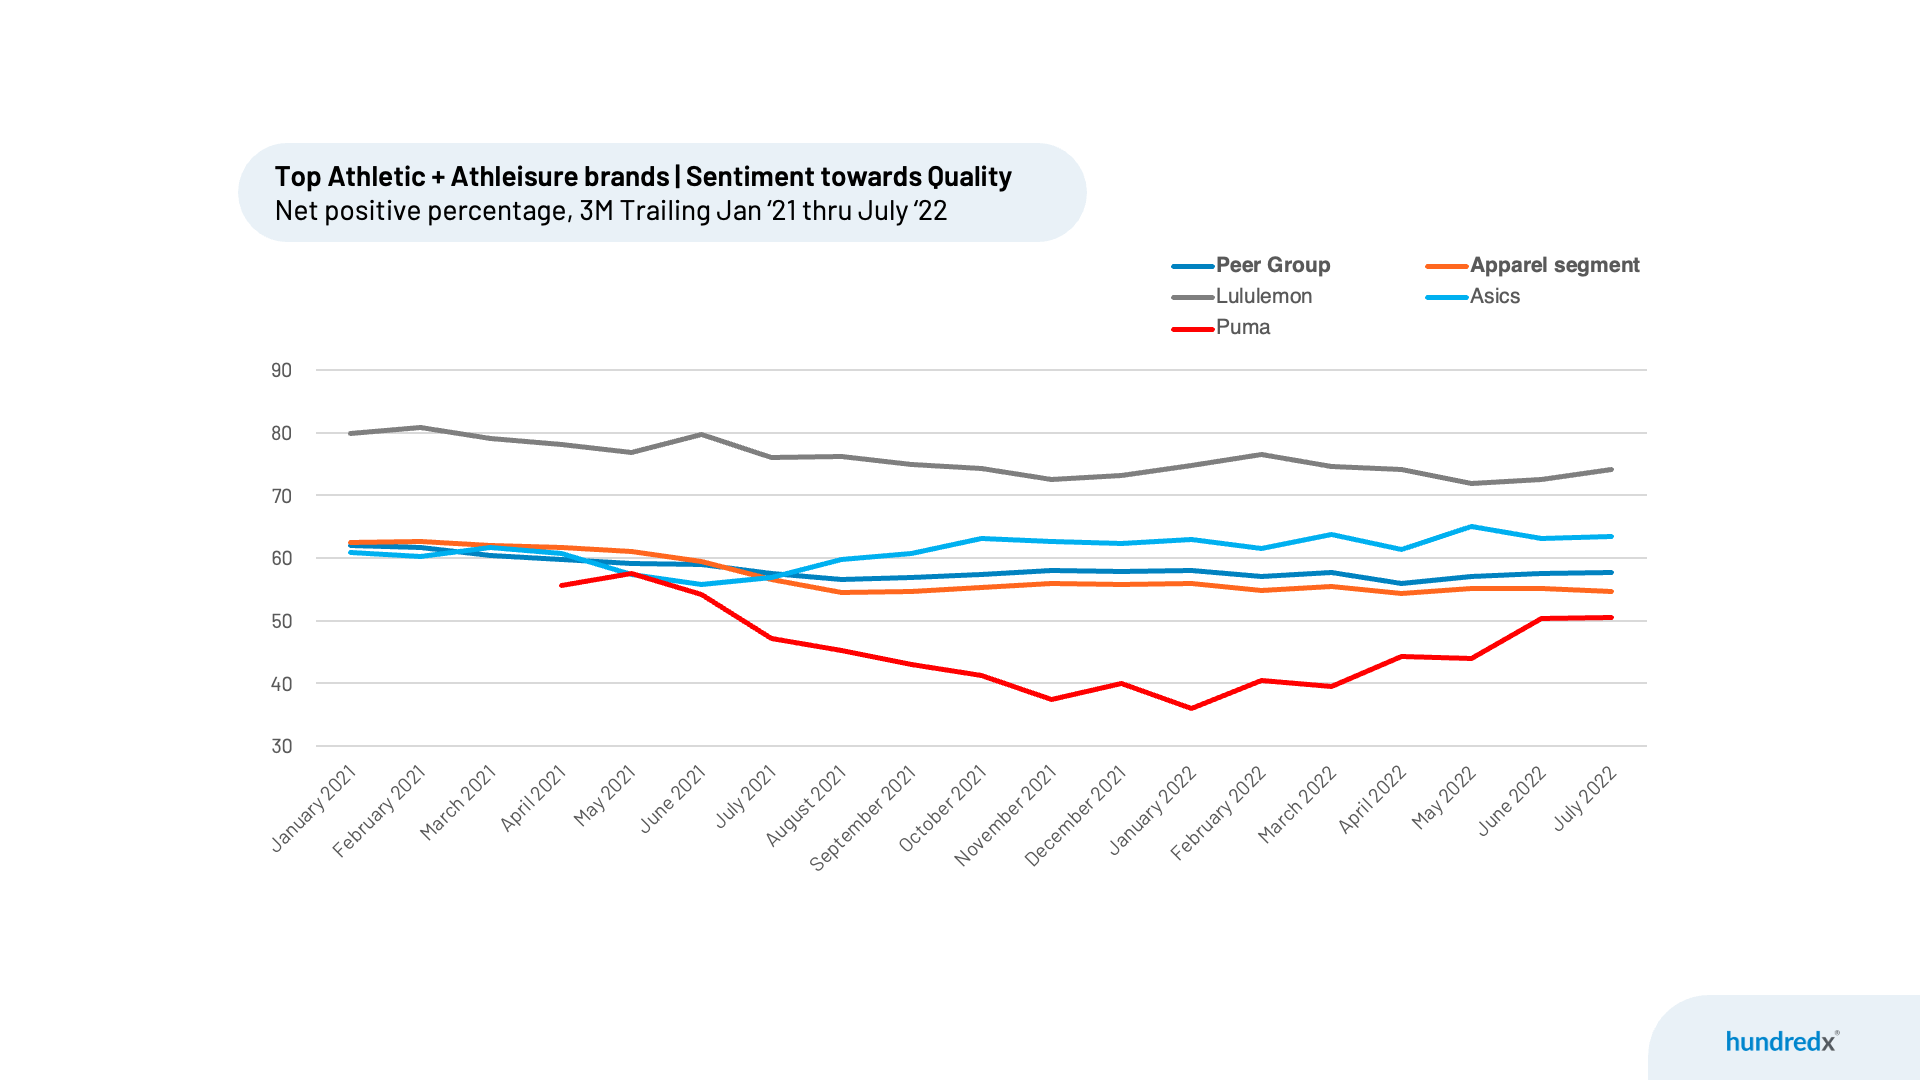
Lululemon leads the A+A peer group when it comes to “Quality” customer satisfaction, with T3M July 2022 NPP of 74%, well ahead of the peer group at 58%. The company has positioned itself as a premium quality product at a premium price, and both are reflected in customer comments as well as their NPP scores. As the top athleisure brand with respect to sentiment on quality, Lululemon has consistently dominated the group by 15%-20% on NPP Quality over the last 18 months.
Asics is the top athletic brand for “Quality” customer satisfaction, with T3M July 2022 NPP of 64%. Customer feedback to HundredX is dominated by discussion of the quality (and reliability) of their running sneakers relative to its competition.
Similar to its recovery in “Styles” customer satisfaction, Puma has seen the biggest improvement in customer sentiment about its “Quality” in the last six months of the peer group.
Availability
There are few things more frustrating when shopping than not being able to find the size or style that you are looking for. Unfortunately, this was an increasingly common occurrence over the last 12 months, as just about all apparel brands dealt with some level of supply chain disruptions due to COVID, inflation, and other factors. The companies that have dealt with these challenges best were rewarded.
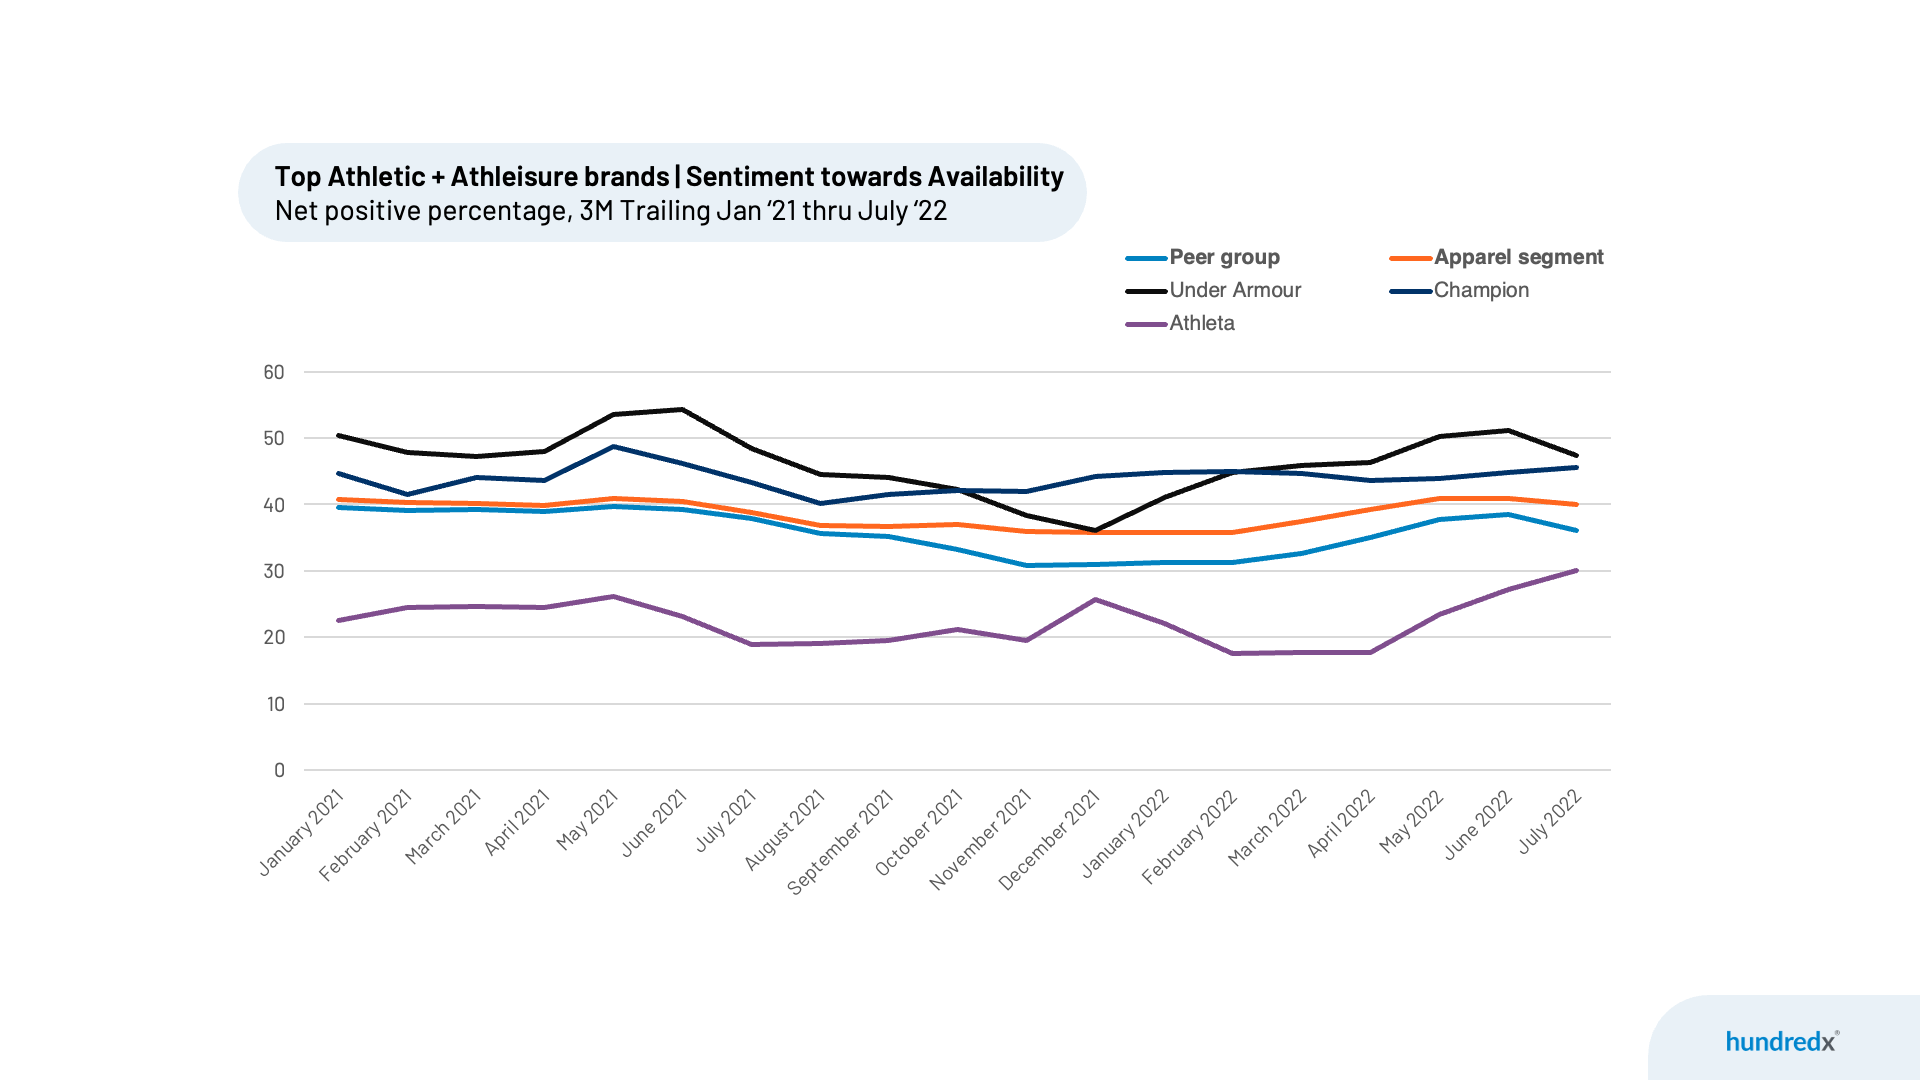
Under Armour and Champion are neck and neck leading the A+A peer group when it comes to “Availability” customer satisfaction, with T3M July 2022 NPP of 47% and 46% respectively, well ahead of the peer group at 36%. Sentiment for both dropped like the rest of the space in 2H 2021, but each maintained leads over the 18 month stretch and recovered this year as supply chains improved. Under Armour spoke about inventory levels recovering as supply chain challenges eased on its August earnings call, and it appears “the Crowd” has noticed.
We also note, Athleta has made the largest gains in “Availability” customer satisfaction, with T3M NPP surging from 18% in February 2022 to 30% in July 2022. It deficit versus the peer group has narrowed from 17% in April 2022 to just 6% in July. Athleta’s parent company, The Gap, Inc., spoke about significant inventory challenges across a number of its brands (most notably Old Navy and Gap) on its May 2022 call. At the time, management said it was pushing a responsive supply chain starting spring 2022 as it saw stabilization in manufacturing and logistics lead times. It appears from HundredX data the crowd is noticing. We look to hear more about what management is seeing on its call next week.
While the backdrop for Athletic and Athleisure brands is certainly more challenging this year, those that do the best jobs investing in Styles, Price, Quality and Availability to satisfy their customers should enjoy the most loyal customers and see the most market share gains.
Strategy Made Smarter
HundredX works with a variety of companies and their investors to answer some of the most important strategy questions in business:
- Where are customers "migrating"?
- What are they saying they will use more of in the next 12 months?
- What are the key drivers of their purchase decisions and financial outcomes?
Current clients see immediate benefits across multiple areas including strategy, finance, operations, pricing, investing, and marketing.
Our insights enable business leaders to define and identify specific drivers and decisions enabling them to grow their market share.
Please contact our team to learn more about which businesses across 75 industries are best positioned with customers and the decisions you can make to grow your brand’s market share.
####
HundredX is a mission-based data and insights provider and does not make investment recommendations. We believe in the wisdom of "the Crowd" to inform the outlook for businesses and industries. For more information on metrics for the Apparel and Athleisure sectors and any of our 75+ other industries, or if you'd like to understand more about using Data for Good, please reach out: https://hundredx.com/contact

