It’s January and it’s cold. But that’s not stopping millions of Americans from insisting on ordering a nice, cold coffee. Sure, a hot coffee could unthaw those frozen hands, but it just doesn’t taste the same, does it?
Now that we’ve incited some cold vs hot coffee debates, we want to get into what really matters in the coffee world – which groups of people plan to visit coffee chains and why. By combing through more than 35,000 pieces of feedback during 2022 on 15 major coffee chains, HundredX finds:
- Younger and lower income groups are positioned to drive coffee industry growth, but neither loved 4th quarter price increases.
- Visit Intent for 18–29-year-olds is at 2% for December 2022, the only positive intent of the age groups we track.
- From the summer through December, customers felt progressively more negative about the prices and value delivered by their coffee chains.
- 4th quarter price increases in response to cost increases have led to Visit Intent dropping the last three months, indicating margins may come under pressure. How customers respond to changes in rewards programs remains to be seen.
- Tim Horton and Caribou Coffee saw surges in customer sentiment towards price and value the last three months, reflecting credit for discount menus and reward programs.
Younger and lower-income groups positioned to drive coffee growth, but neither loved price increases
It’s almost ironic that younger adults are powering growth for the coffee industry in the U.S. The group with the highest metabolisms and energy levels seemingly relies on caffeine more than older adults. In its full-year earnings call in November, Starbucks revealed more than half of its U.S. customers are Gen-Z or millennials. Starbucks continued growth, it appears, has a lot to do with younger customers.
But, it’s not just the world’s largest coffee chain that appeals to young adults. Looking at feedback from “The Crowd” of customers of 15 of the largest U.S. coffee chains in the U.S., HundredX sees the demand growth outlook from 18-29-year-olds as more favorable than any other age group.
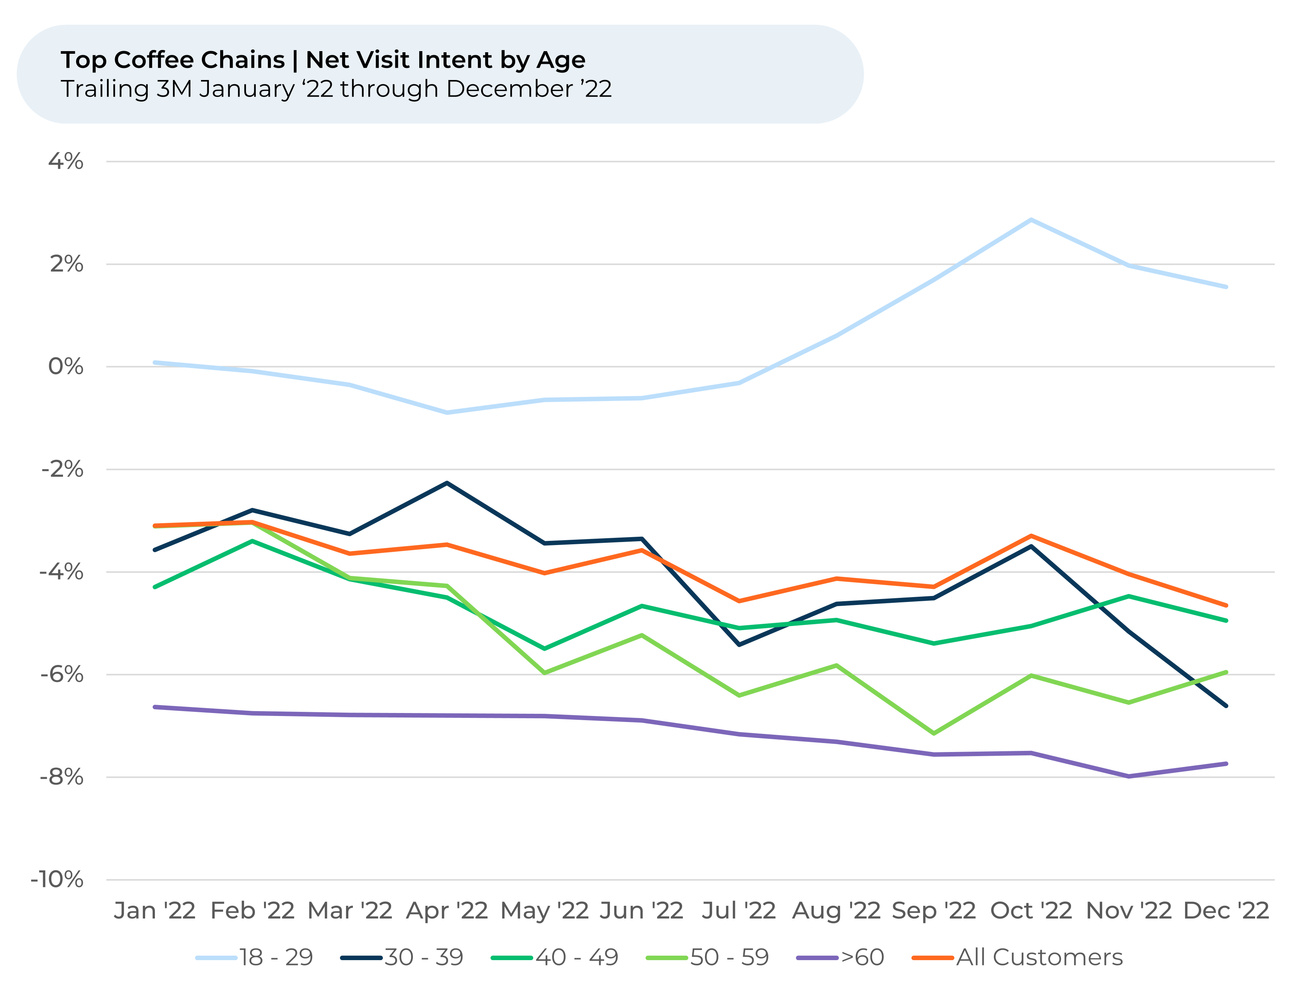
Visit Intent1 for that age group is at 2% for December 2022, the only positive intent of all the age groups we track. The spread in intent between 18-29-year-olds and the broader industry widened throughout 2022, indicating it has become a bigger part of the industry growth story. The 18-29-year-old Visit Intent sits well above the average of -4% for all age groups. Visit Intent for people over 60 years old is the lowest at -8%.
Visit Intent reflects the percentage of customers who plan to visit a specific coffee chain more during the next 12 months minus the percentage that intends to visit less.
We find Price is a top three reason why people say they like or dislike a coffee chain, behind Taste and Speed. We believe significant price increases during the 4th quarter at the major coffee chains is one of the top reasons purchase intent has been falling across all age groups since October. People drinking less iced coffee, a major source of revenue for some coffee chains, during the winter months also contributes to the decline. We find purchase intent fell recently for all groups of customers under 50 years old (greatest for 30-39), while it was actually up modestly for both 50-59 and 60+-year-old customers.
“The Crowd’s” different reactions to rising prices is even better explained by looking at the trends by household income, which appear to correlate strongly with age.
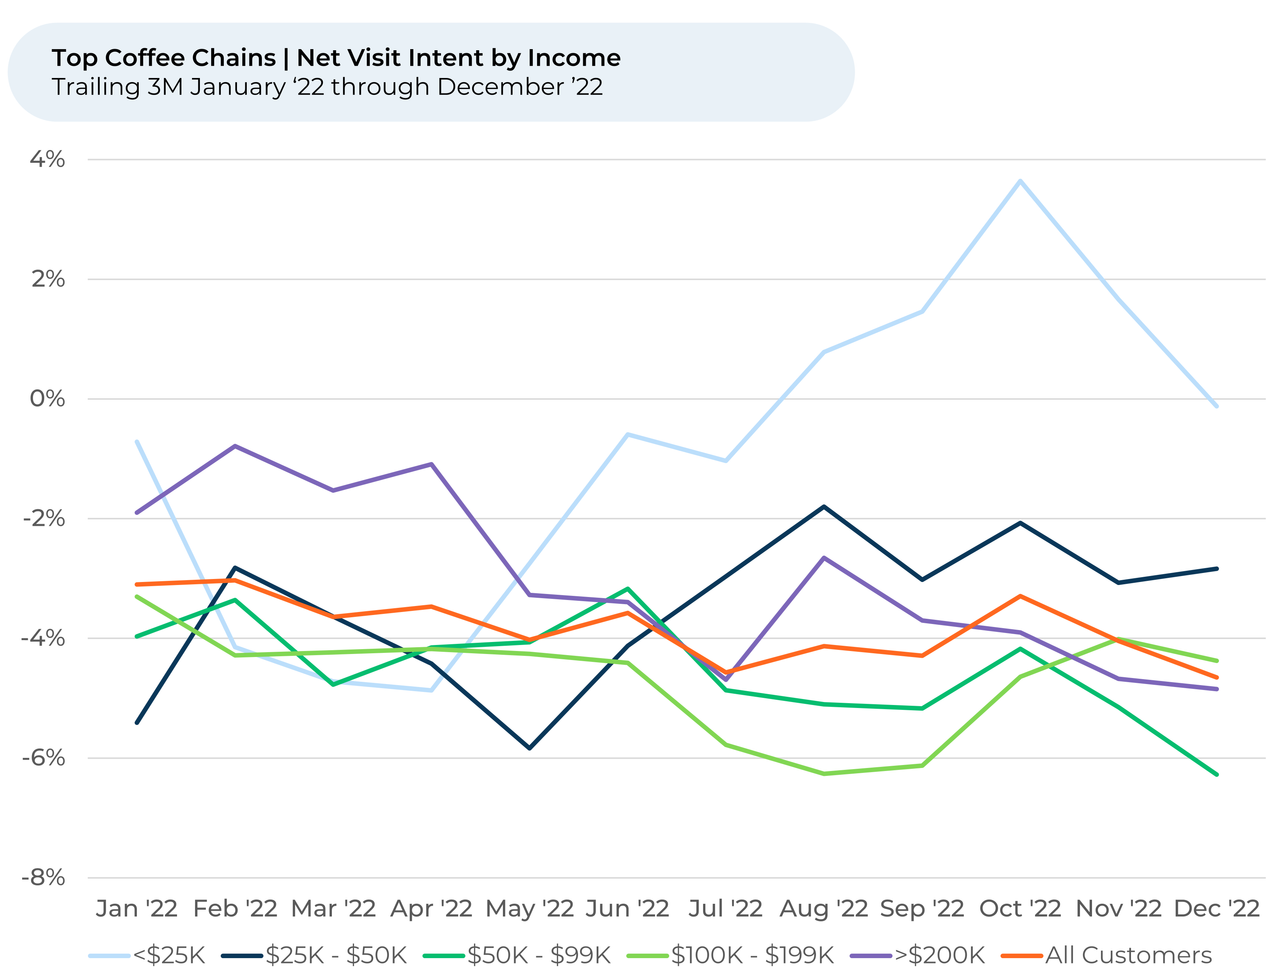
In the last three months, Visit Intent fell the most for customers making $25K or less per year, which likely also captures a lot of 18-29-year-olds in college and just starting their careers. This group sees the largest decline in Visit Intent since October, falling 4% compared to the 1% fall for all groups. Intent did not change materially for customers making $100K-$199K and $200K+ per year in the last three months.
Customers turning more negative on industry price and value
HundredX data shows that from the summer through December, people have felt progressively more negative about price and the value delivered by their coffee chains.
Since June, coffee drinkers’ sentiment on Price fell 5% on average for major coffee brands. Their sentiment on Value fell 6% during that period.
HundredX measures sentiment towards a driver of customer satisfaction as the percentage of customers who view a factor as a reason they liked the brand or product minus the percentage who see the same factor as a negative.
That could be unfortunate news for some major coffee brands looking to cut costs amid financial uncertainty. Dunkin’ Donuts changed its rewards system in October, dramatically increasing the number of points it takes customers to earn free products. Starbucks is rolling out similar changes to its reward program in February 2023.
While we believe Value should be the factor most impacted by negative customer reactions to rewards changes, we see the potential for it to show up in sentiment towards App Ordering as well as overall Visit Intent. App ordering sentiment fell by 3% in the last two months for Dunkin’ Donuts while it was flat for Starbucks.
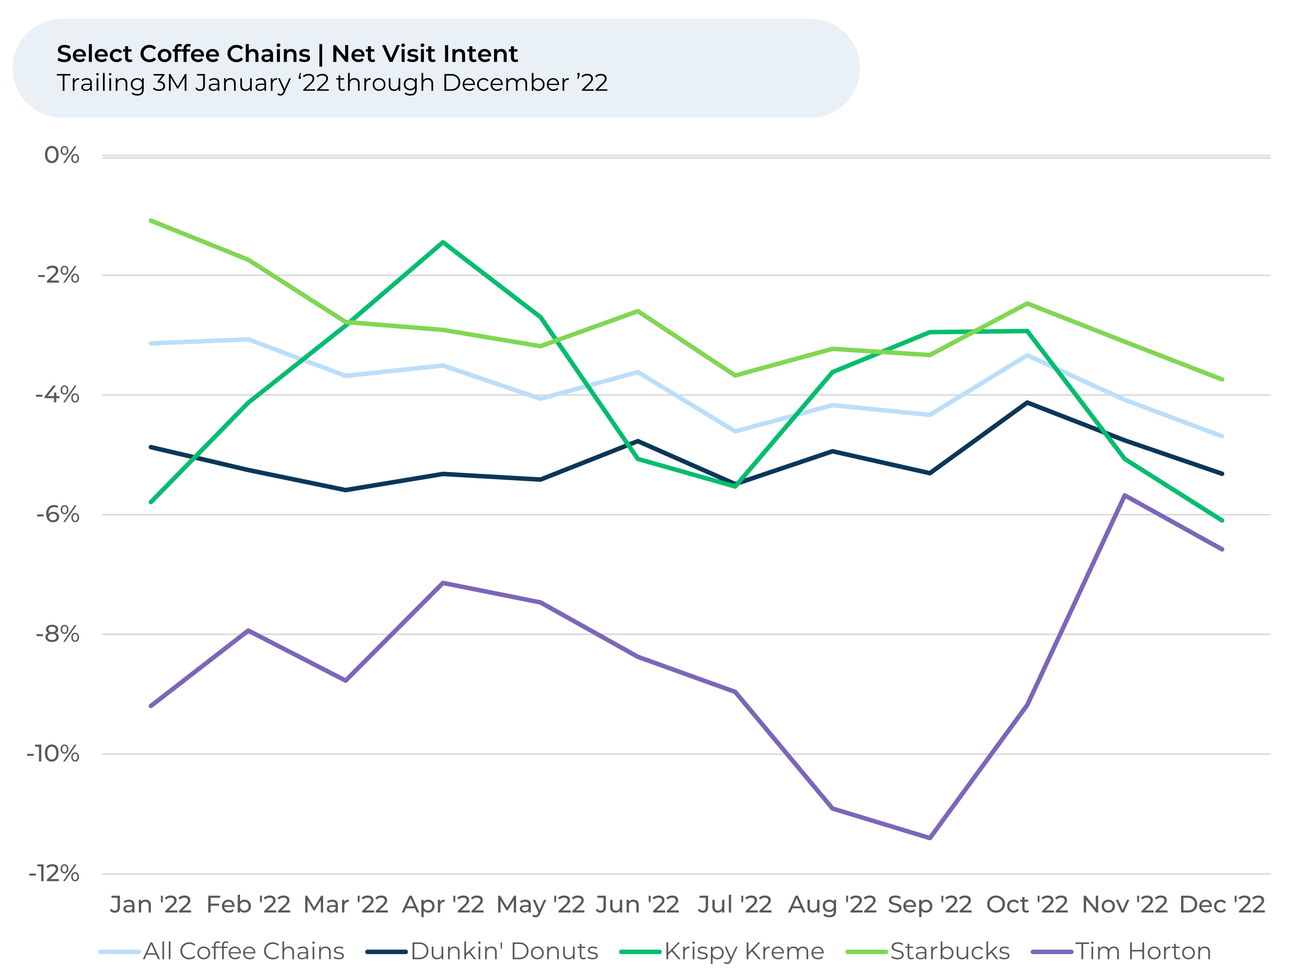
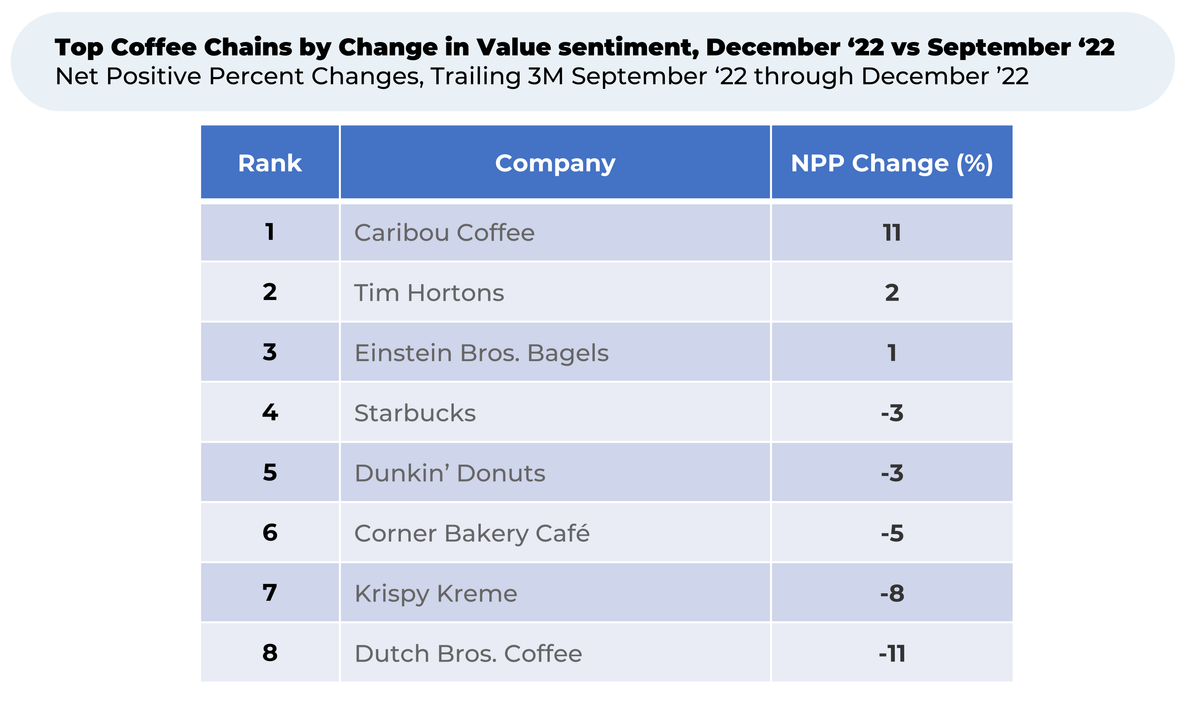
Over the past three months, we found customers’ sentiment on Value dropped 3% on average across the major coffee chains. While most chains saw decreases in Value sentiment, some coffee chains outperformed -- in particular, Caribou Coffee increased 10% and Tim Hortons increased 2%.
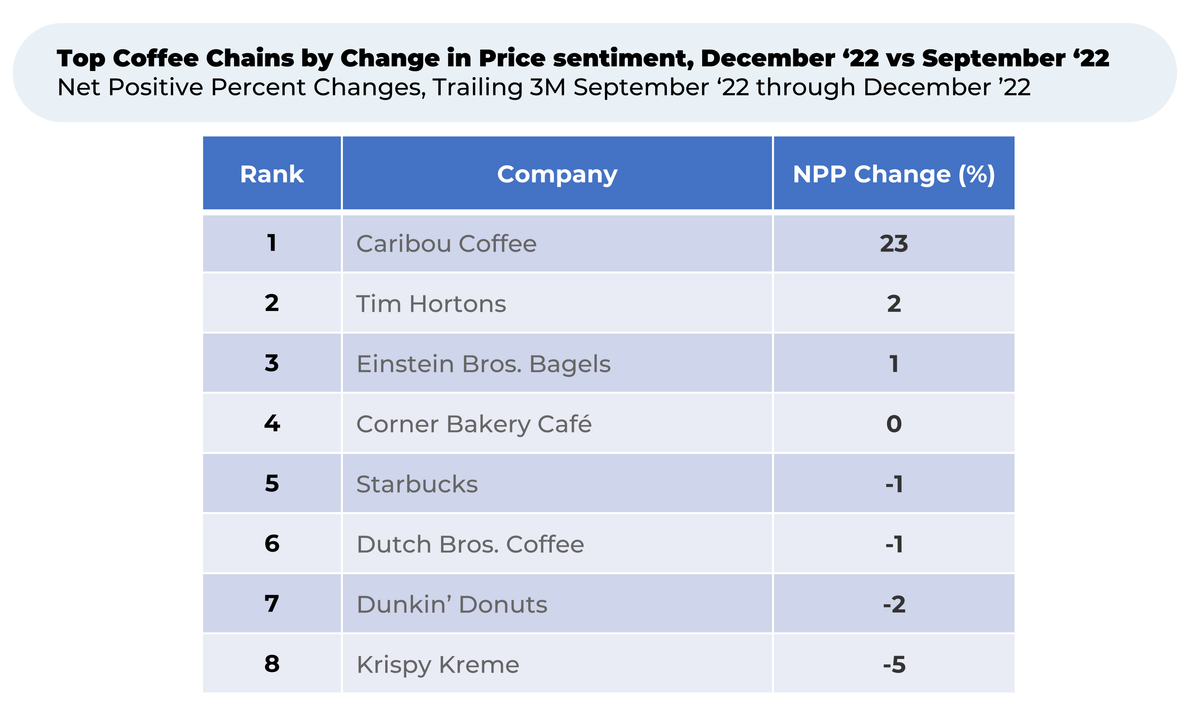
Meanwhile, sentiment on Price dropped 1% in the last three months. Again, Caribou Coffee is a major outperformer (+22%), with Tim Horton’s rising again by 2%.
That’s all to say that coffee chains might not have the pricing power they think as they make changes to their rewards programs and menus. Food prices increased significantly across the board last year due to inflation. Breakfast-type foods were hit particularly hard. The U.S. Department of Agriculture says the prices of eggs increased 32%, cereals and bakery products increased 13% and dairy products increased 12%.
However, Coffee prices decreased from $2.40 per pound in September to $1.70 at the end of December. And some coffee brands – Caribou Coffee and Tim Hortons, particularly – seem to be pleasing customers with their value and price in recent months. Tim Hortons just launched TimSelects, a new menu offering some breakfast foods for under $3.
“Tim Horton's is very tasty and very reasonable,” someone told HundredX.
Caribou Coffee, based in Minnesota, refreshed its rewards program in September. The company didn’t increase the number of points needed to earn a free coffee – instead, it released a new mobile app and now allows loyalty members to earn points online. Members can use points for more items, including discounts on online orders. Customers seemingly like the value it provides.
The Dunkin’ Difference
While we’ve found the growth outlook for coffee as an industry to be strongest from its youngest and lowest-income customers, Dunkin’ Donuts appears to draw in a different crowd.
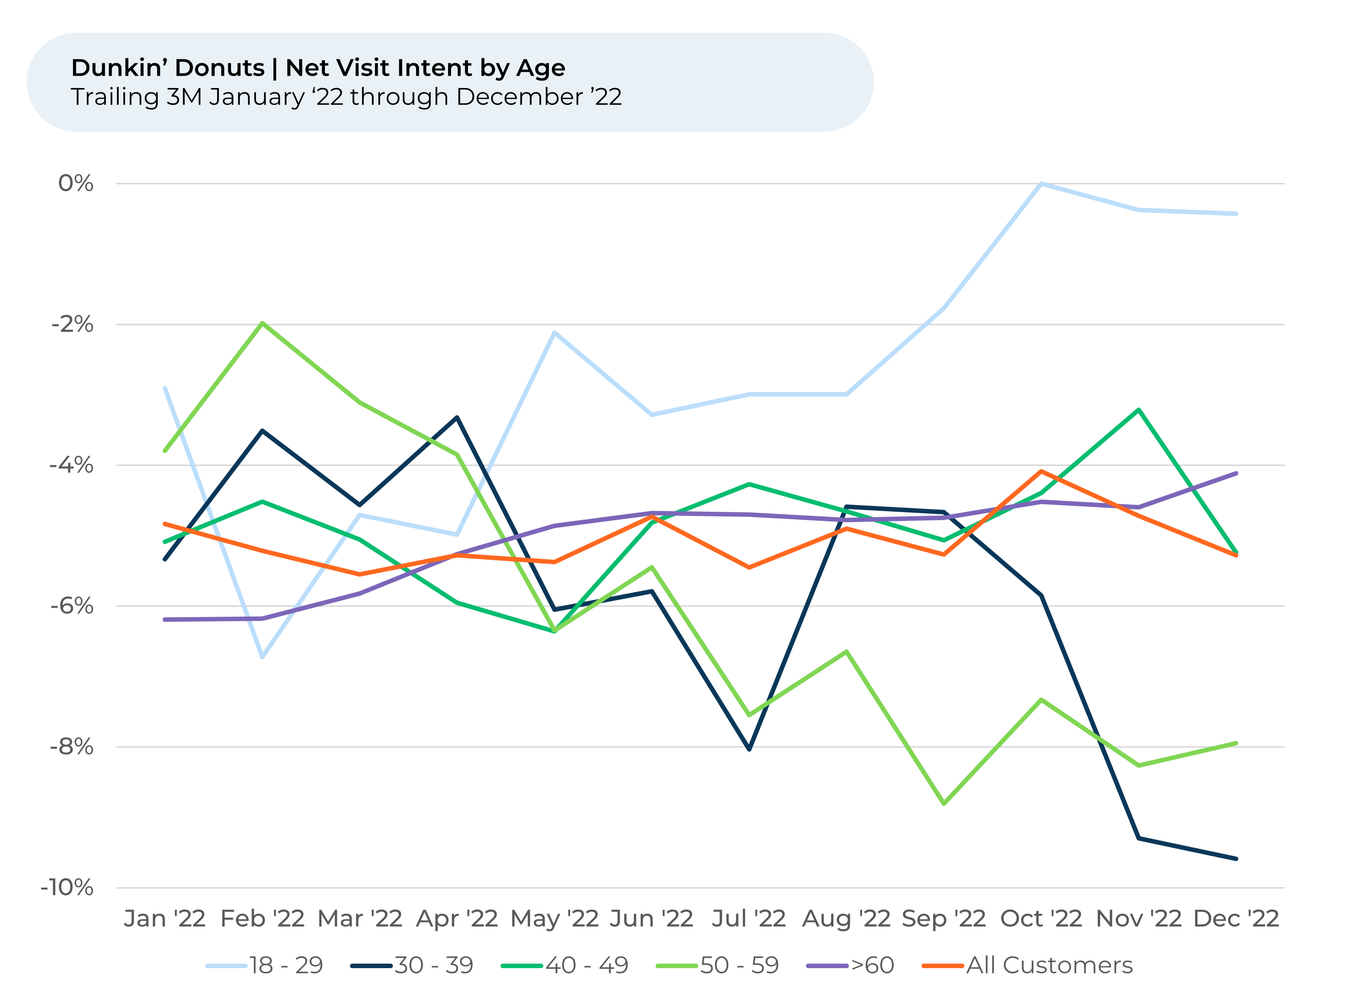
While Dunkin’s Visit Intent is highest with the 18-29-year-old group (0%), the 60+ group is 2nd highest (at -4%) - very different from the overall industry where 60+ ranks last. It appears Dunkin’ is getting a tremendous lift from its decision to focus on the older crowd by offering an official discount to AARP members.
“Glad they offer Senior Discounts,” one person told HundredX of Dunkin’ Donuts.
Another person over 60 years old said, “Dunkin' Donuts often offers good coffee/donut deals. Their coffee is always hot.”
What will coffee drinkers do in 2023? Time will tell. And so will HundredX. We will continue monitoring the coffee space to which brands best manage changes to prices, reward programs, apps and more to outperform.
- All metrics presented, including Net Usage Intent (Usage Intent), and Net Positive Percent / Sentiment are presented on a trailing three-month basis unless otherwise noted.
Strategy Made Smarter
HundredX works with a variety of companies and their investors to answer some of the most important strategy questions in business:
- Where are customers "migrating"?
- What are they saying they will use more of in the next 12 months?
- What are the key drivers of their purchase decisions and financial outcomes?
Current clients see immediate benefits across multiple areas including strategy, finance, operations, pricing, investing, and marketing.
Our insights enable business leaders to define and identify specific drivers and decisions enabling them to grow their market share.
Please contact our team to learn more about which businesses across 75 industries are best positioned with customers and the decisions you can make to grow your brand’s market share.
####
HundredX is a mission-based data and insights provider. HundredX does not make investment recommendations. However, we believe in the wisdom of the crowd to inform the outlook for businesses and industries. For more info on specific drivers of customer satisfaction, other companies within 75+ other industries we cover, or if you'd like to learn more about using Data for Good, please reach out: https://hundredx.com/contact.


