Discount stores are a bargain hunter's paradise, but they often lack the cleanliness and organized appeal of grocery and superstores. Recently, several leading national publications have explored the unclean and unsafe conditions in discount stores, with much of their insights gathered through employee interviews. Many focused specifically on Dollar General, one of the fastest growing discount stores in the U.S. While employee testimonials provide a valuable inside view, it's the opinions of the everyday shoppers that ultimately determines how much a brand can grow.
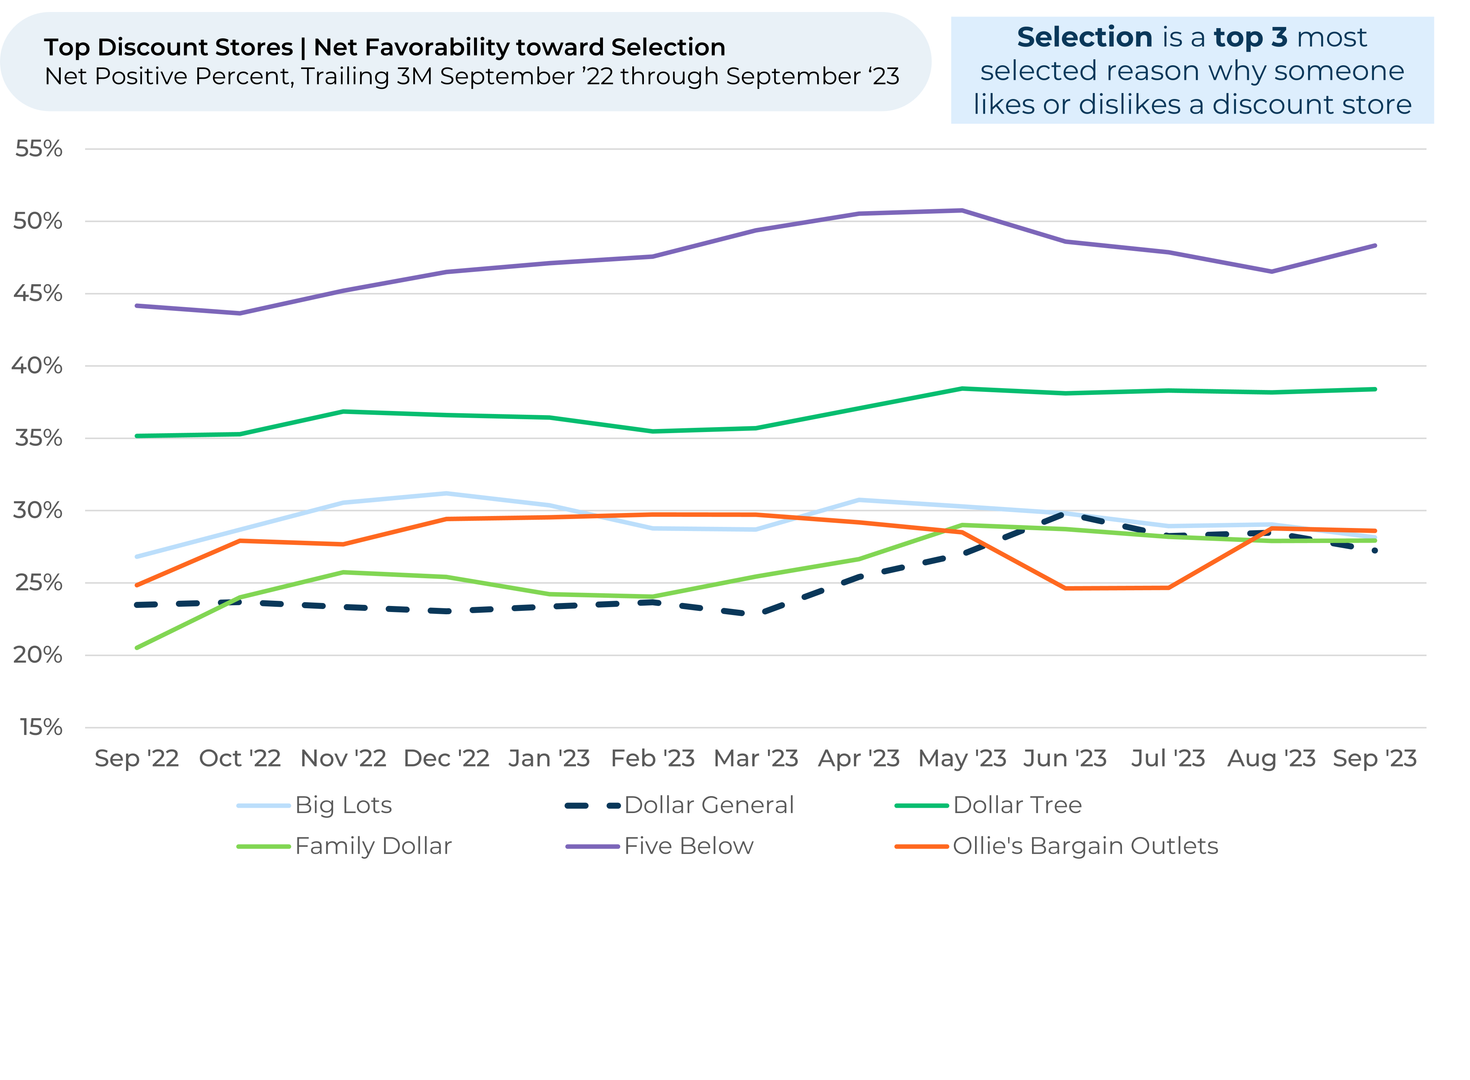
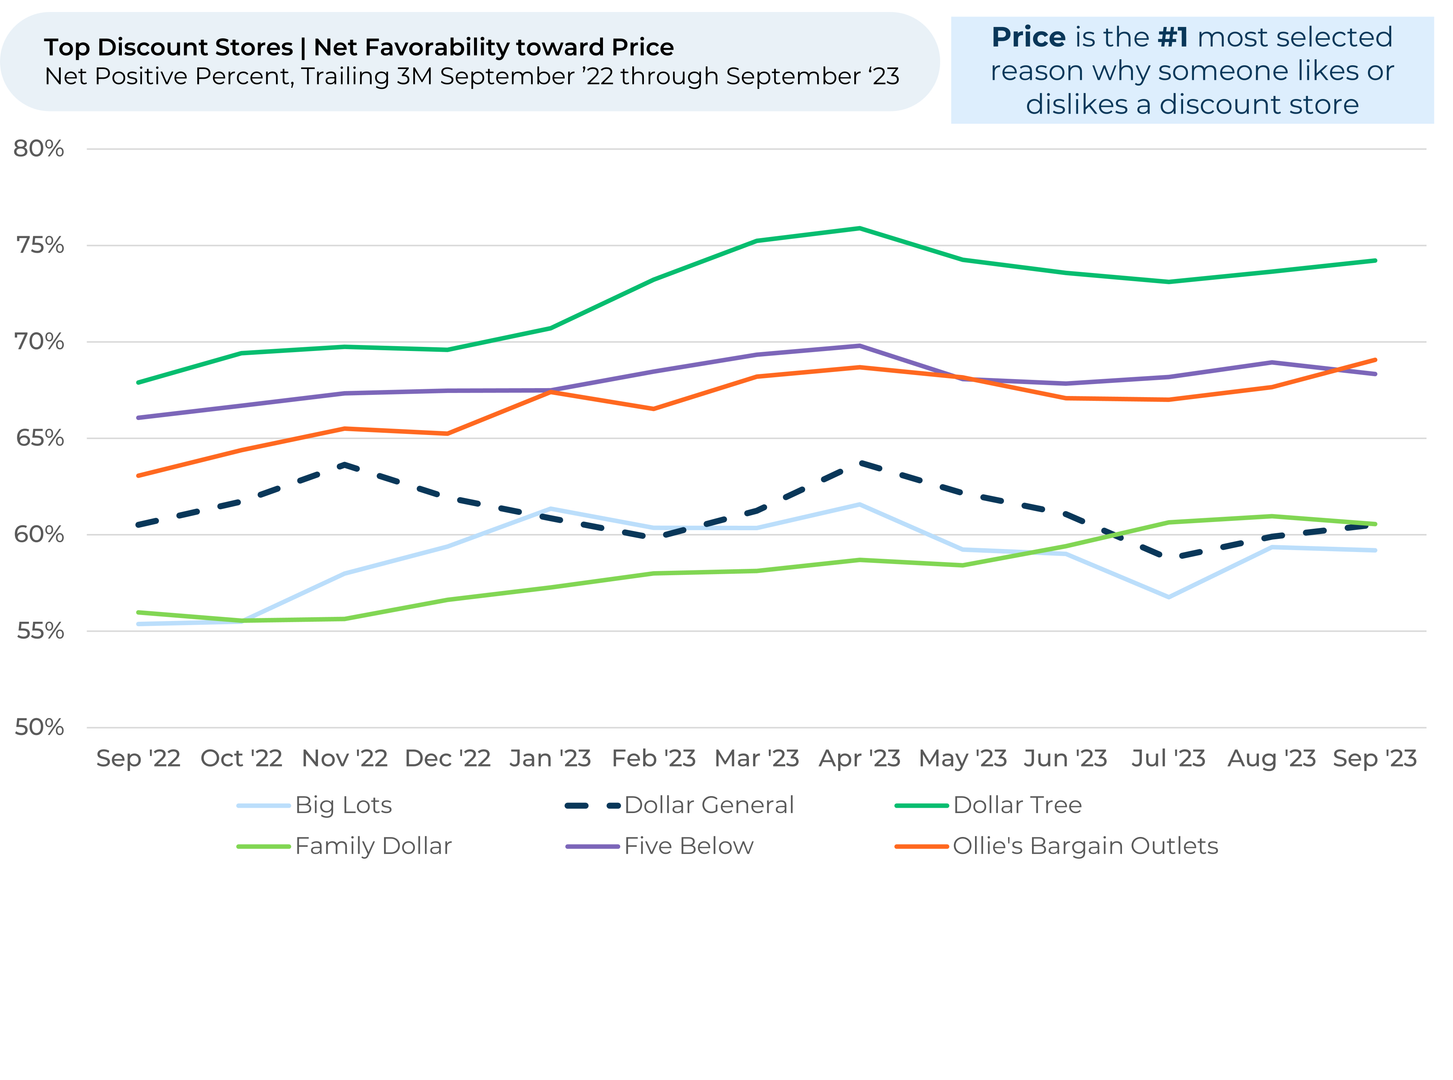
Looking to “The Crowd” of shoppers that visit discount stores across the country, we find that while shoppers do find Dollar General unclean, they don’t seem to care. The brand’s low prices, combined with its growing selection of items, are keeping customers coming back. It will need to continue delivering on these value propositions in order to sustain recent improvements to its growth outlook.
As one discount store shopper expressed to HundredX in September, “People do not go to [discount stores] expecting good customer service and cleanliness, they go for inexpensive products.”
Examining 80,000 pieces of feedback from seven discount brands, we find:
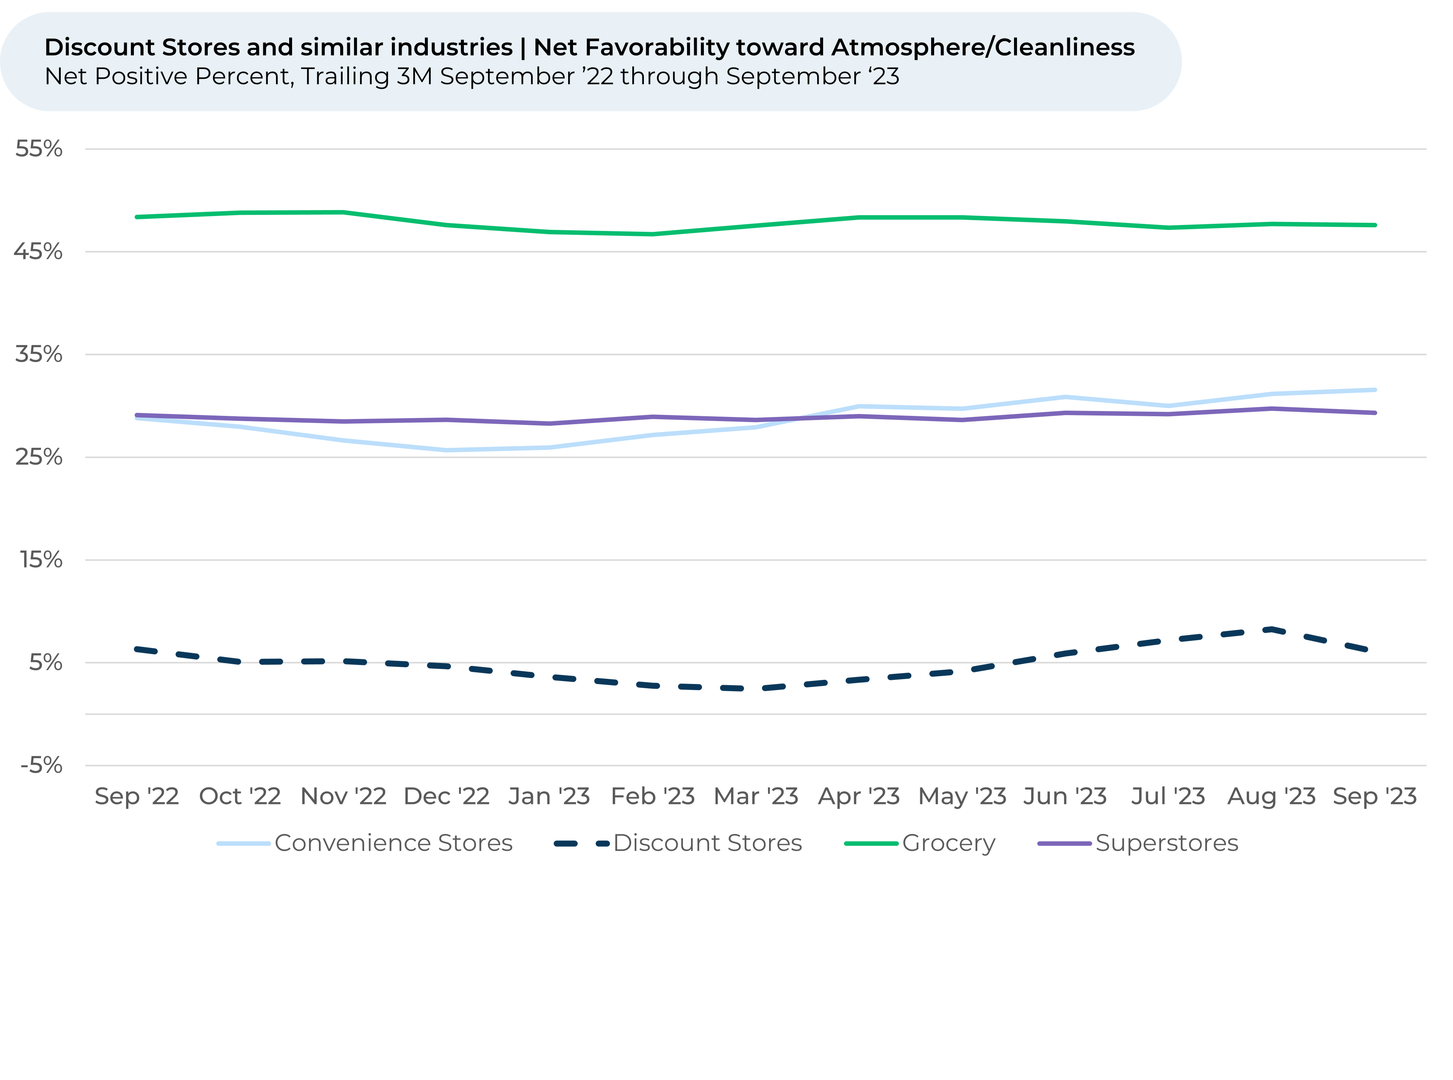
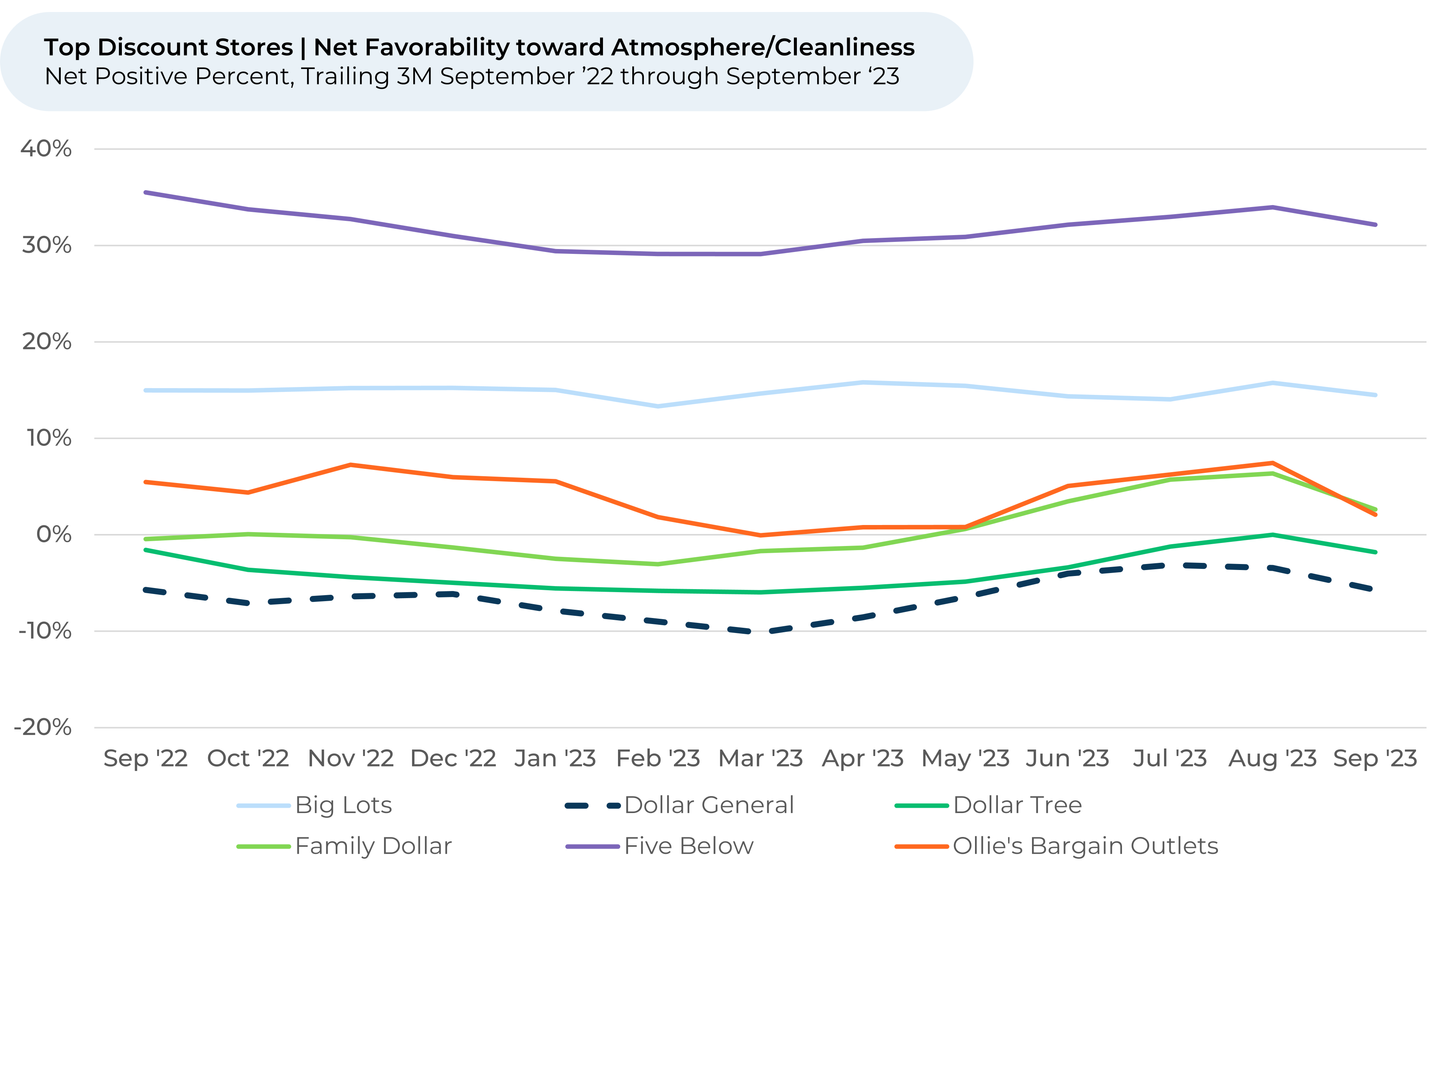
- Shoppers do indeed perceive¹,² discount stores in general as less clean and poorly laid out compared to their counterparts in similar retail arenas like convenience, grocery, and superstores.
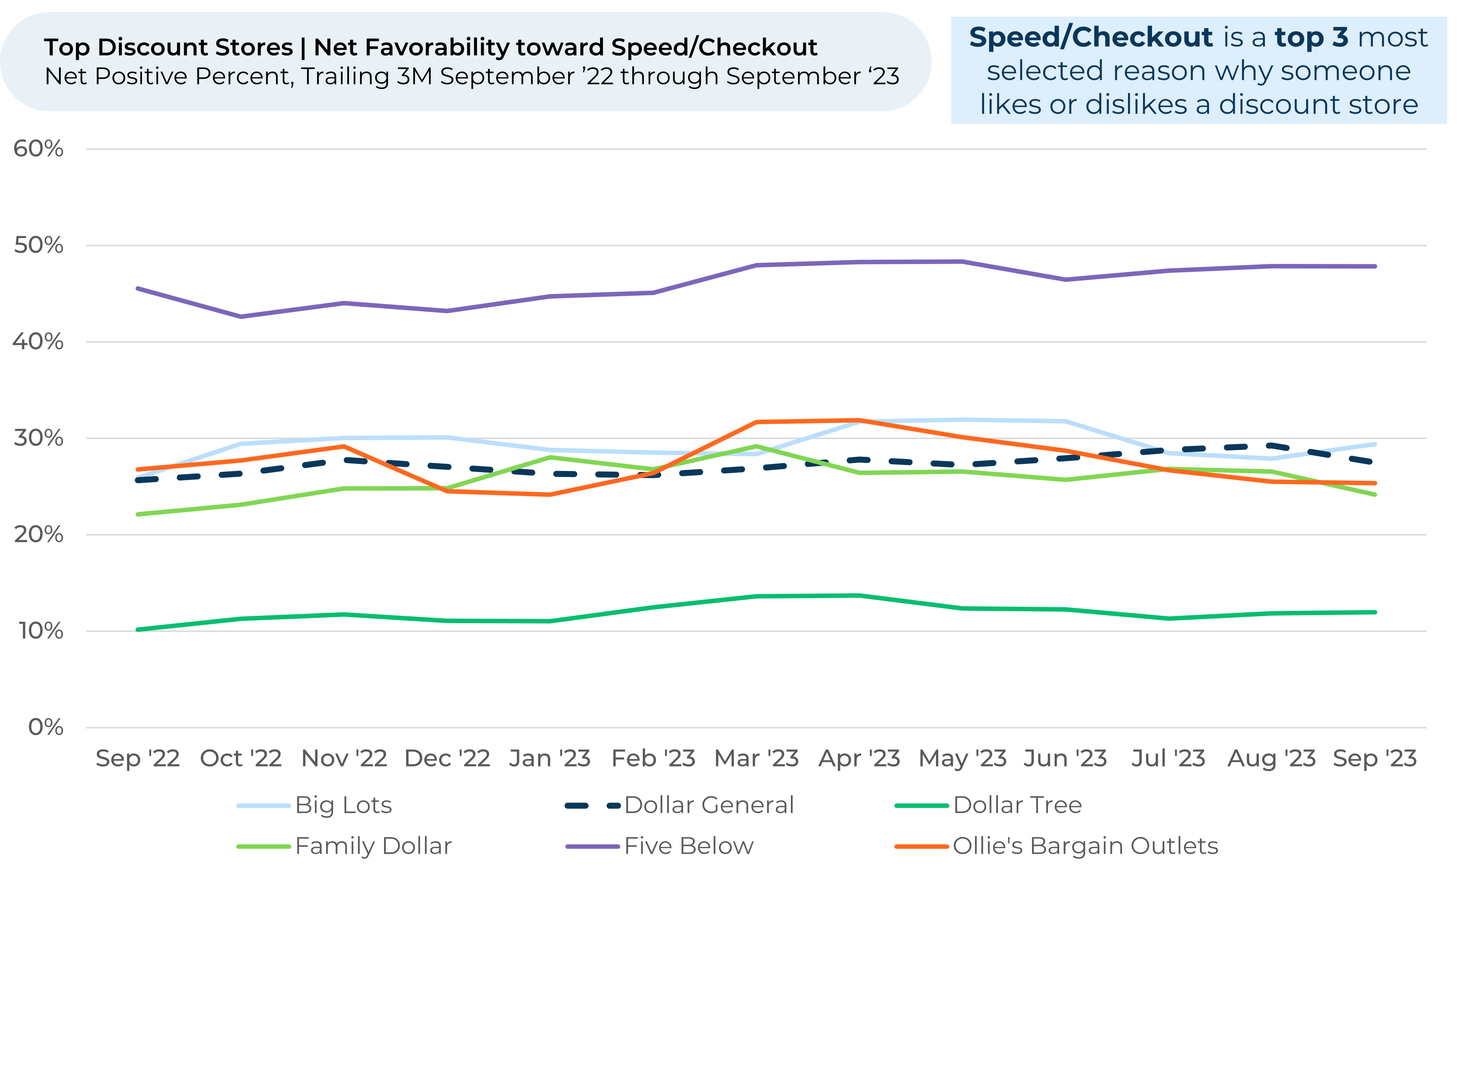
- Despite the cleanliness issues, discount stores continue to uphold their value proposition. Customers prioritize price, selection, and speed over tidiness.
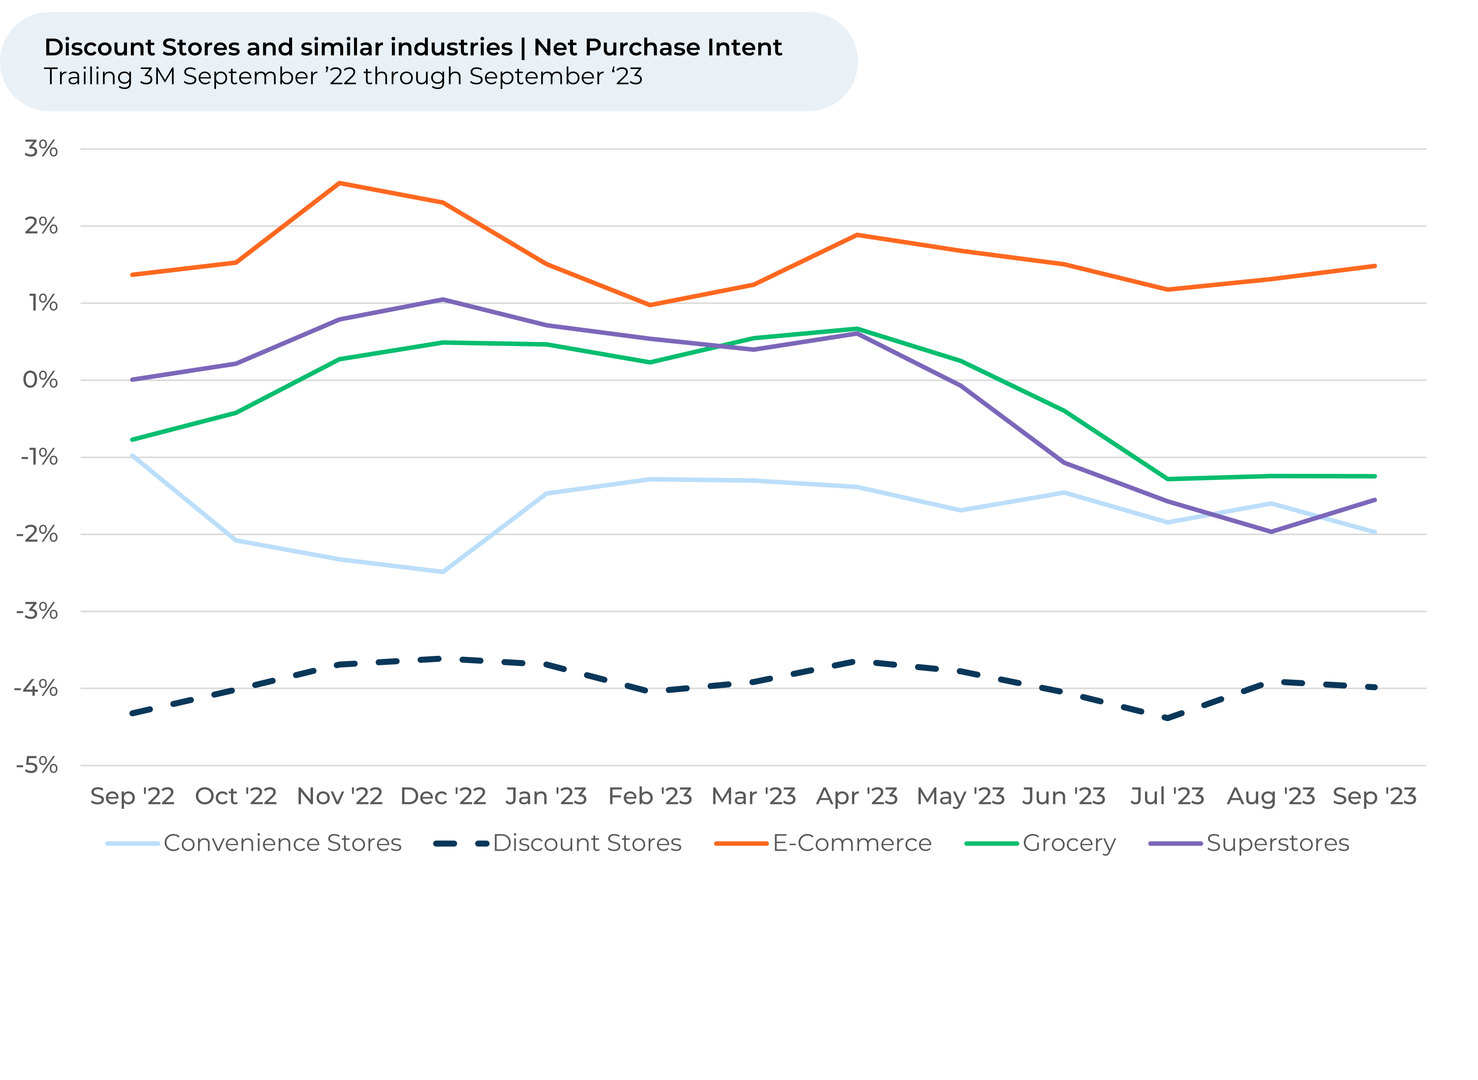
- Purchase Intent³ has been more resilient for discount stores over the past year than it has been for similar industries with cleaner stores.
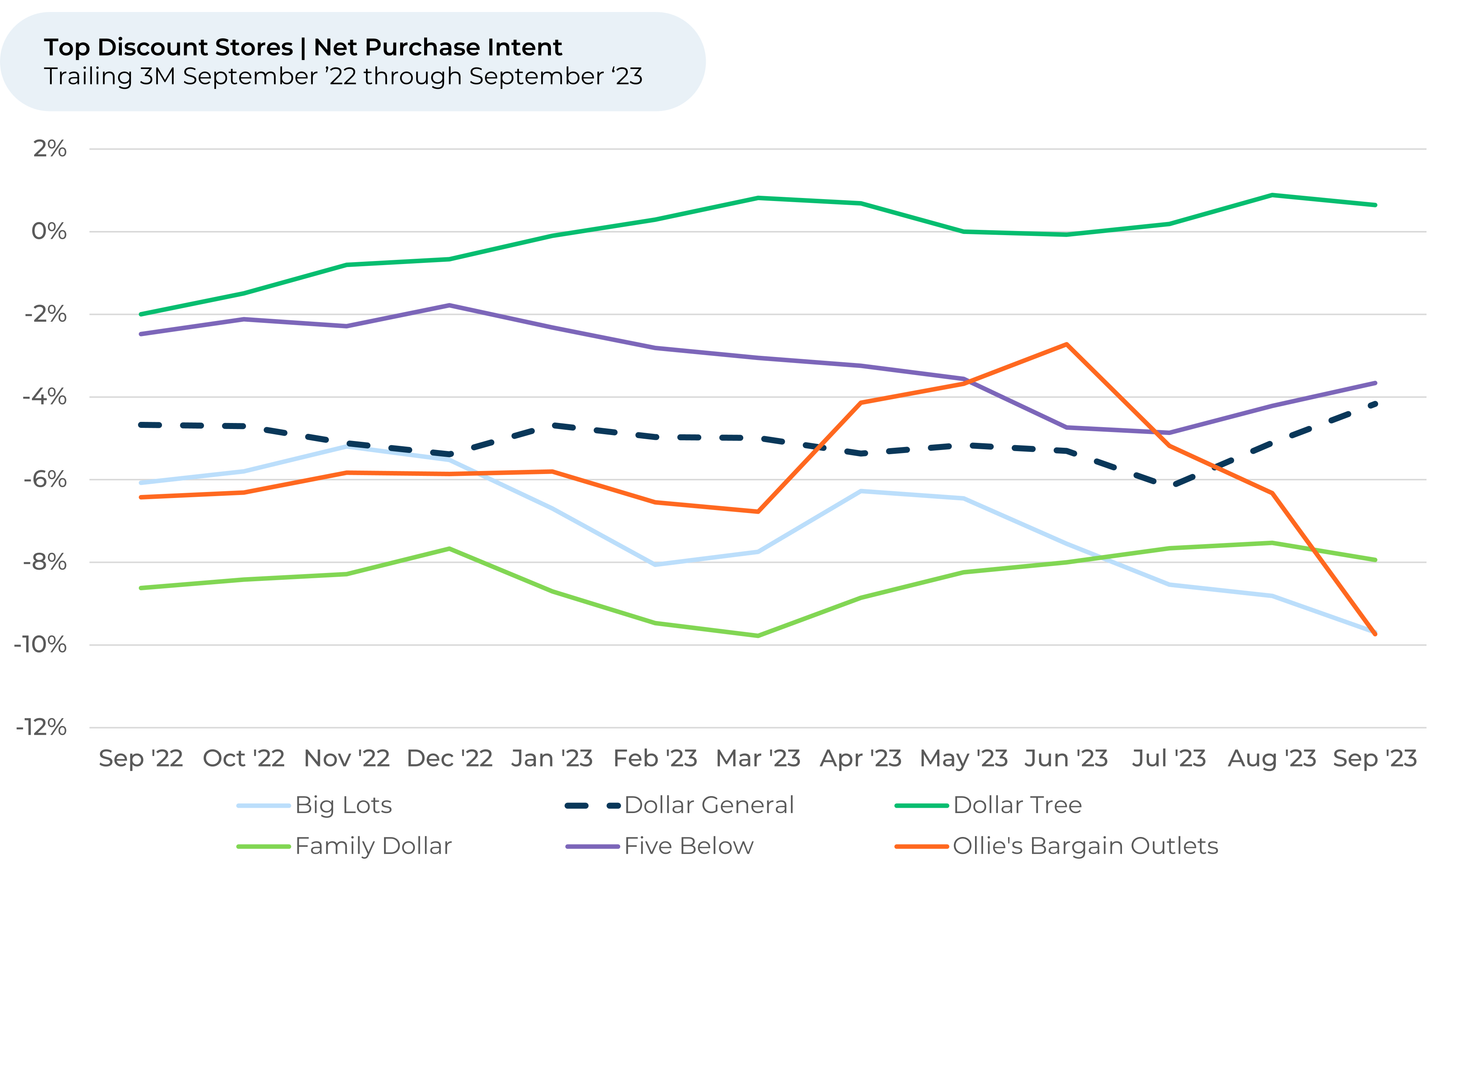
- Despite being viewed as the least clean, Dollar General saw an uptick in customers wanting to spend more over the past year – indicating market share is likely to shift as its purchase intent rose more than brands perceived to have cleaner stores.
- At the same time, Dollar General, once trailing in product selection, is closing the gap on perception as it diversifies its shelves to attract more affluent shoppers.
- Dollar General performs relatively well on price and speed, but it’s starting to fall behind peers. To sustain growth, emulating Dollar Tree’s strategy of low prices and efficient checkouts could prove to be pivotal.
- In comments to HundredX, customers praise the inexpensive products at discount stores, but call out unclean conditions.
- “[One discount store] is great for cards, party goods, etc. So, kudos to you for everyday items. However, the cleanliness.....oy! Every time I walk into my local store, I cringe at the front door and all the fingerprints on the glass,” one shopper said in September.
- Another recently offered some advice. “If the store was a little more organized and clean you'd have more people come in.”
Please contact our team for a deeper look at HundredX's discount stores data, which includes more than 180,000 pieces of customer feedback across over 7 discount store brands.
- All metrics presented, including Net Purchase (Purchase Intent) and Net Positive Percent / Favorability, are presented on a trailing three-month basis unless otherwise noted.
- HundredX measures Net Favorability towards a driver of customer satisfaction as Net Positive Percent (NPP), which is the percentage of customers who view a factor as a positive (reason they liked the products, people, or experiences) minus the percentage who see the same factor as a negative.
- Purchase Intent represents the percentage of customers who expect to spend more with that chain over the next 12 months, minus those that intend to spend less. We find businesses that see Purchase Intent trends gain versus the industry or peers have often seen revenue growth rates, margins, and/or market share also improve versus peers.
Strategy Made Smarter
HundredX works with a variety of companies and their investors to answer some of the most important strategy questions in business:
- Where are customers "migrating"?
- What are they saying they will use more of in the next 12 months?
- What are the key drivers of their purchase decisions and financial outcomes?
Current clients see immediate benefits across multiple areas including strategy, finance, operations, pricing, investing, and marketing.
Our insights enable business leaders to define and identify specific drivers and decisions enabling them to grow their market share.
Please contact our team to learn more about which businesses across 75 industries are best positioned with customers and the decisions you can make to grow your brand’s market share.
####
HundredX is a mission-based data and insights provider. HundredX does not make investment recommendations. However, we believe in the wisdom of the crowd to inform the outlook for businesses and industries. For more info on specific drivers of customer satisfaction, other companies within 75+ other industries we cover, or if you'd like to learn more about using Data for Good, please reach out: https://hundredx.com/contact.

