A blue and white logo for hundredx on a white background
A bunch of remote controls are lined up on a table

As the Fed and consumers continue to navigate a very tricky economic environment, we look at what areas are seeing price sentiment shift the most for insight into how it will likely impact consumer behavior. 


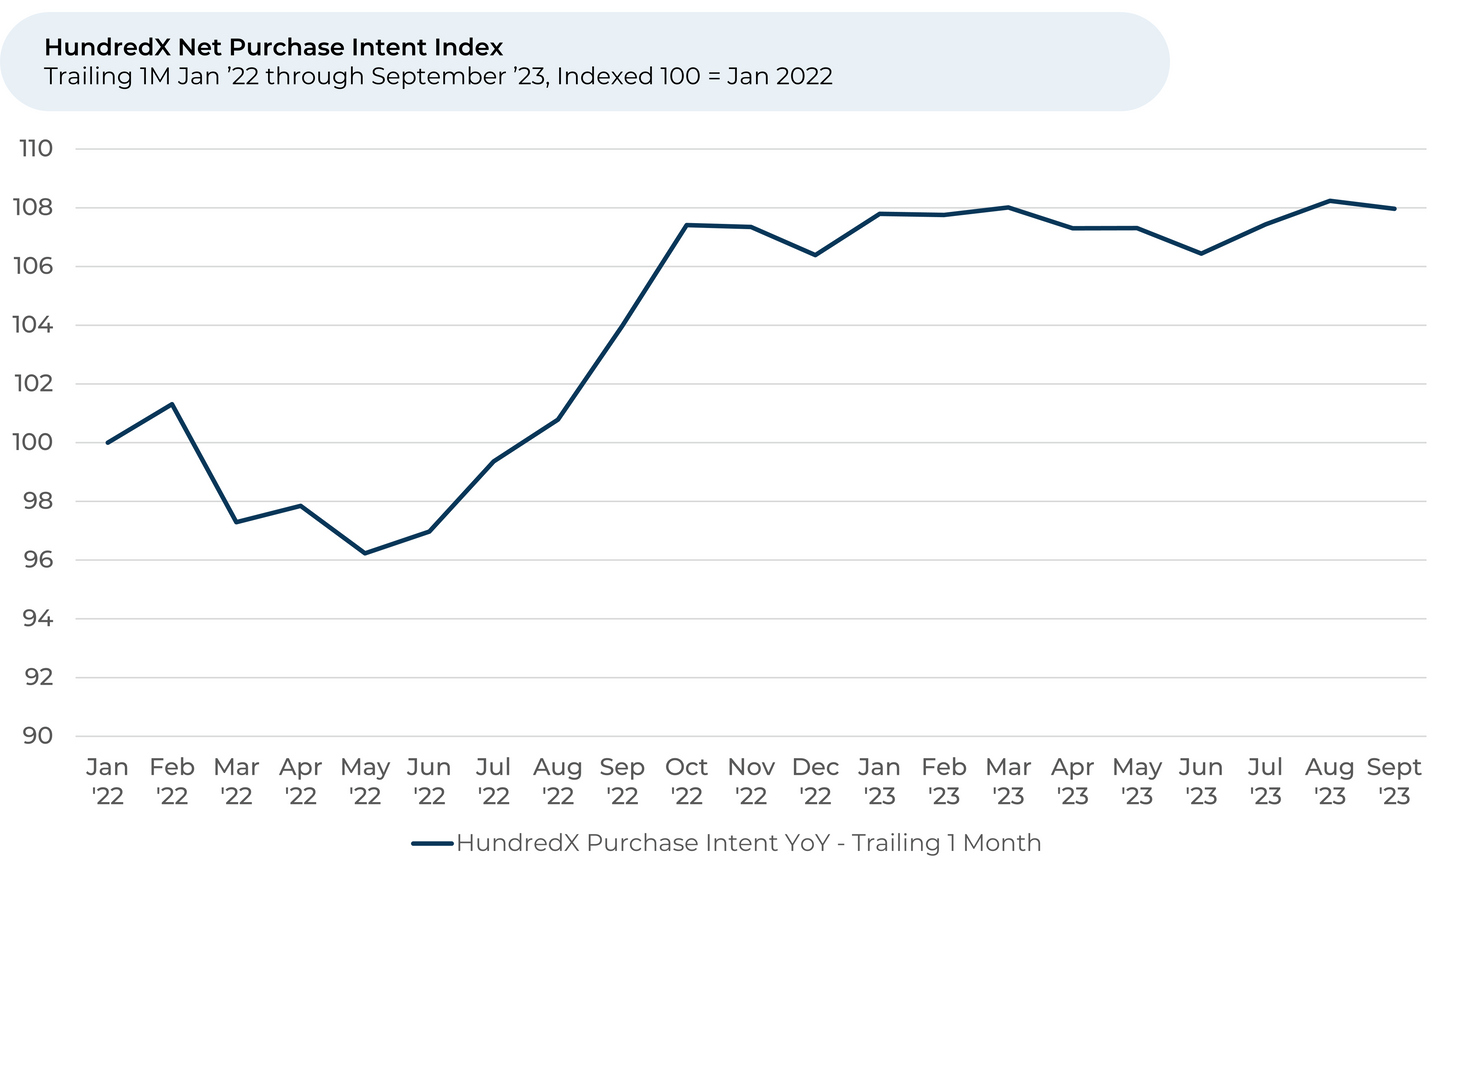
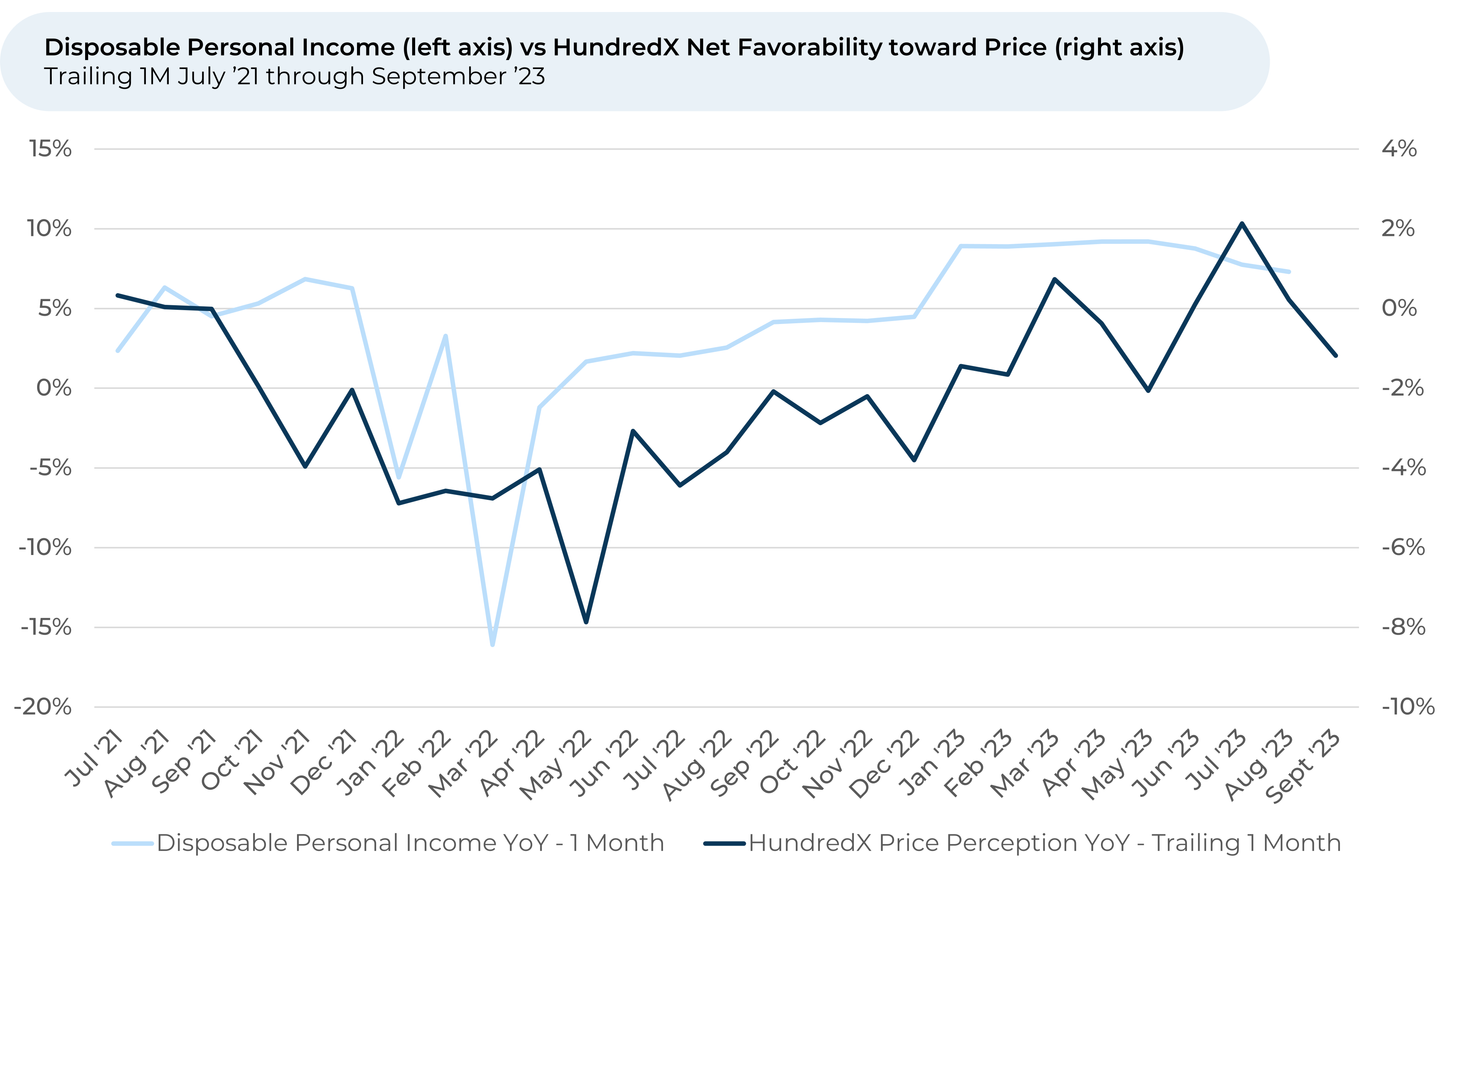
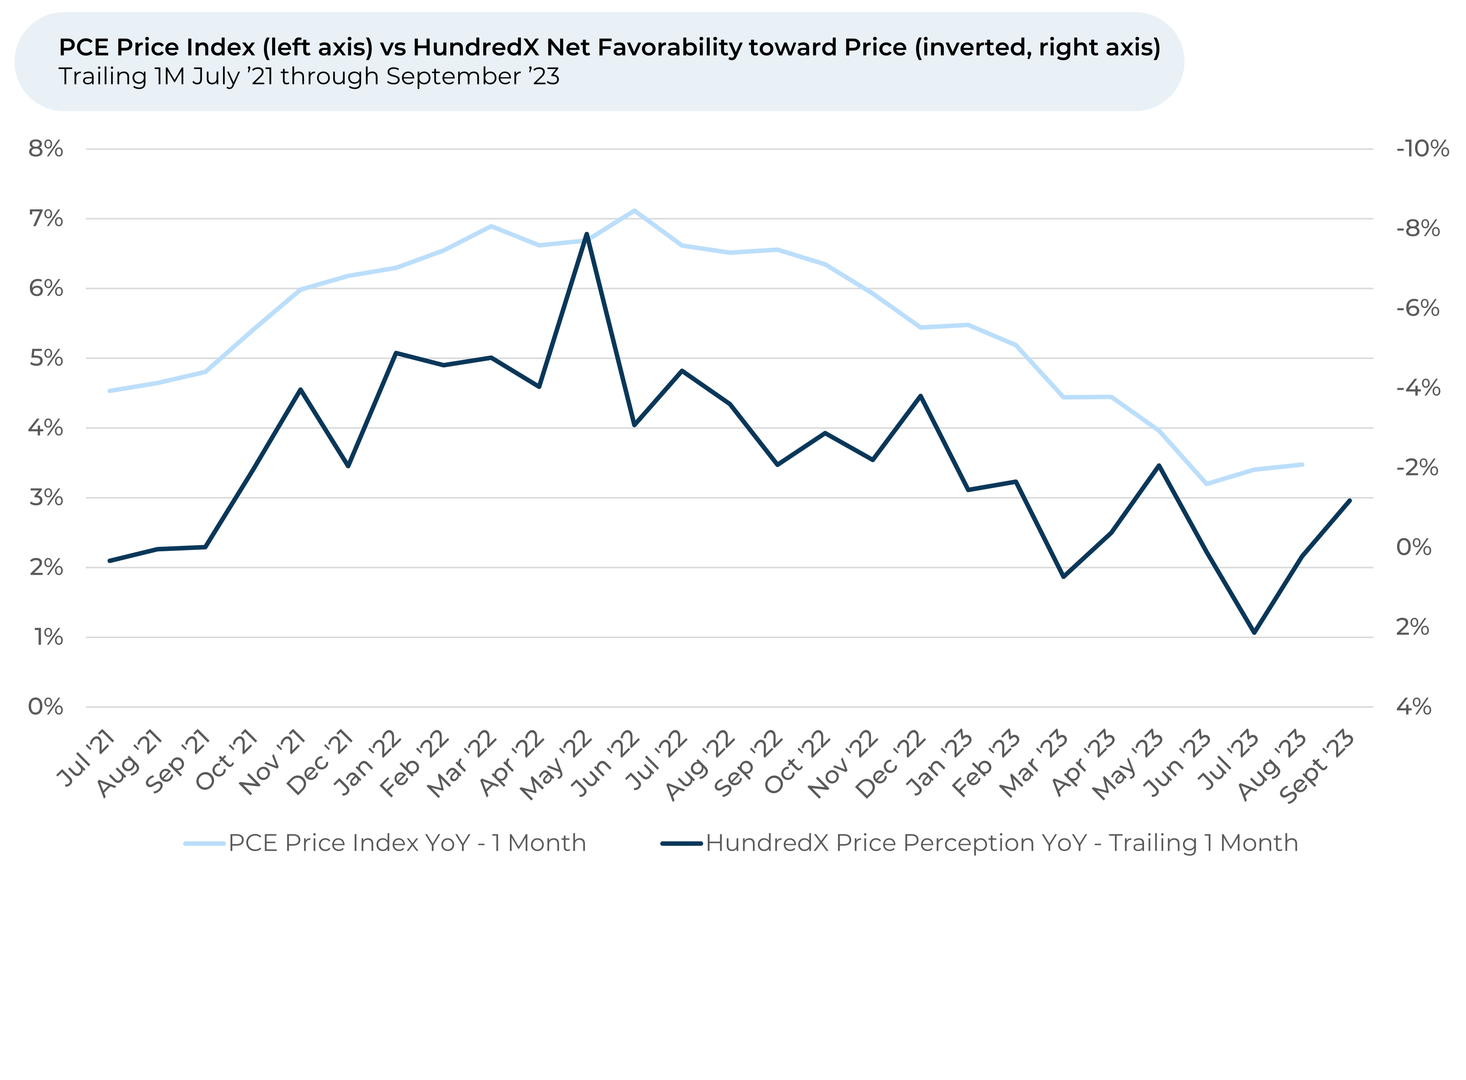
Over the past two months, customers’ overall perception of prices across all industries has fallen by 3%, negating the gains we observed earlier this year and indicating inflation probably has not come down in the last month. Changes in HundredX’s Price favorability¹,² index are typically inversely correlated with movement in the Personal Consumption Expenditures (PCE) Price levels (i.e. inflation) reported by the US government. HundredX’s Net Purchase Intent Index remained stable in September, indicating the consumer demand outlook is pretty unchanged despite stubborn inflation. 


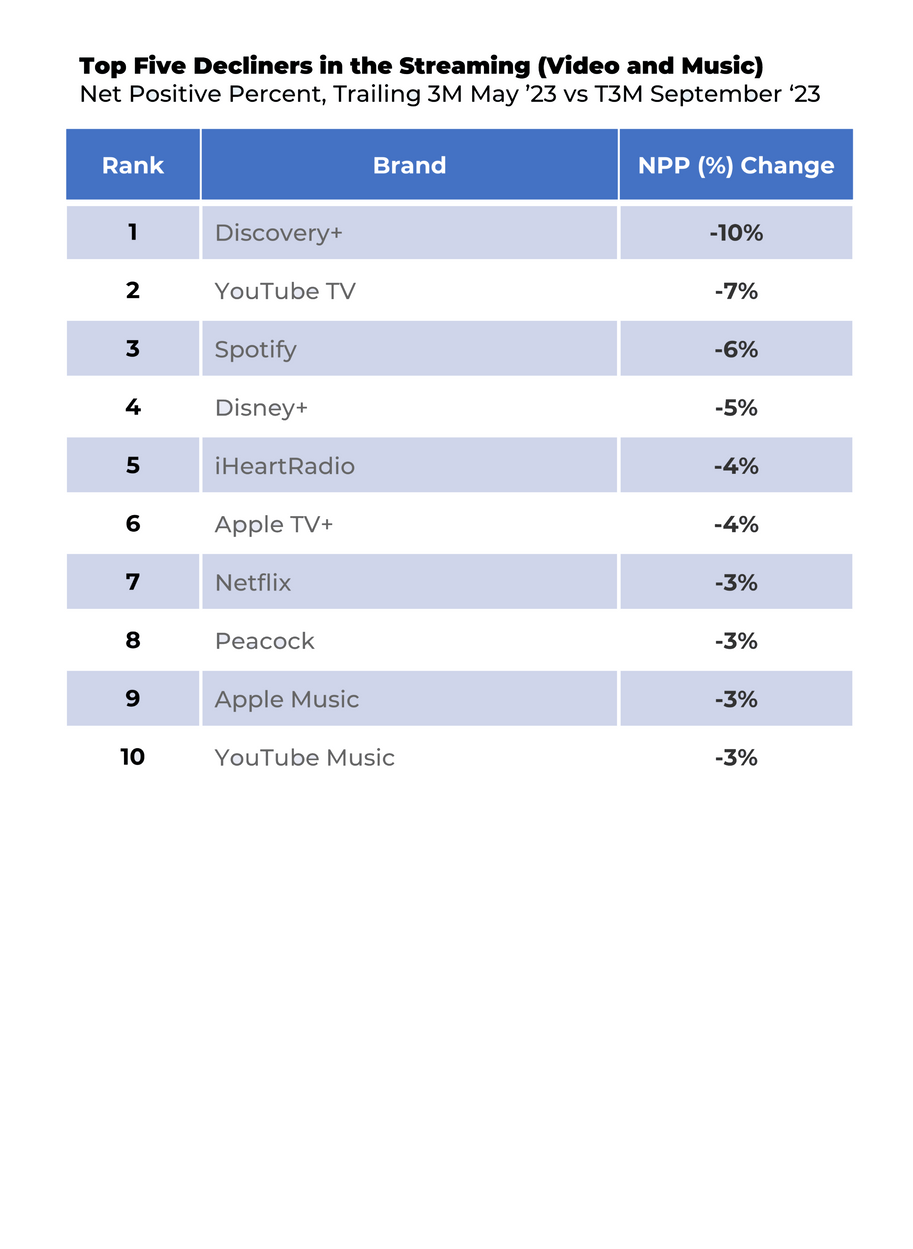
Online and app-based services, initially lauded as market disruptors for their affordability, now face users grappling with their climbing costs. Interestingly, the spike in the cost of streaming services seems to be reviving interest in cable.

Analyzing millions of pieces of customer feedback from July 2021 across 82 industries and 3,000+ companies, we find:

  • Price sentiment for online and app-based services fell the most over the last three months, but it doesn’t seem to be hurting demand. Customers feel unhappier about the cost of online dating services, video streaming and music streaming. However, the price increases don’t seem to be stopping people from using their favorite online services; since May, Usage Intent³ is up for online dating (+5%) and music streaming (+1%) and flat for video streaming.
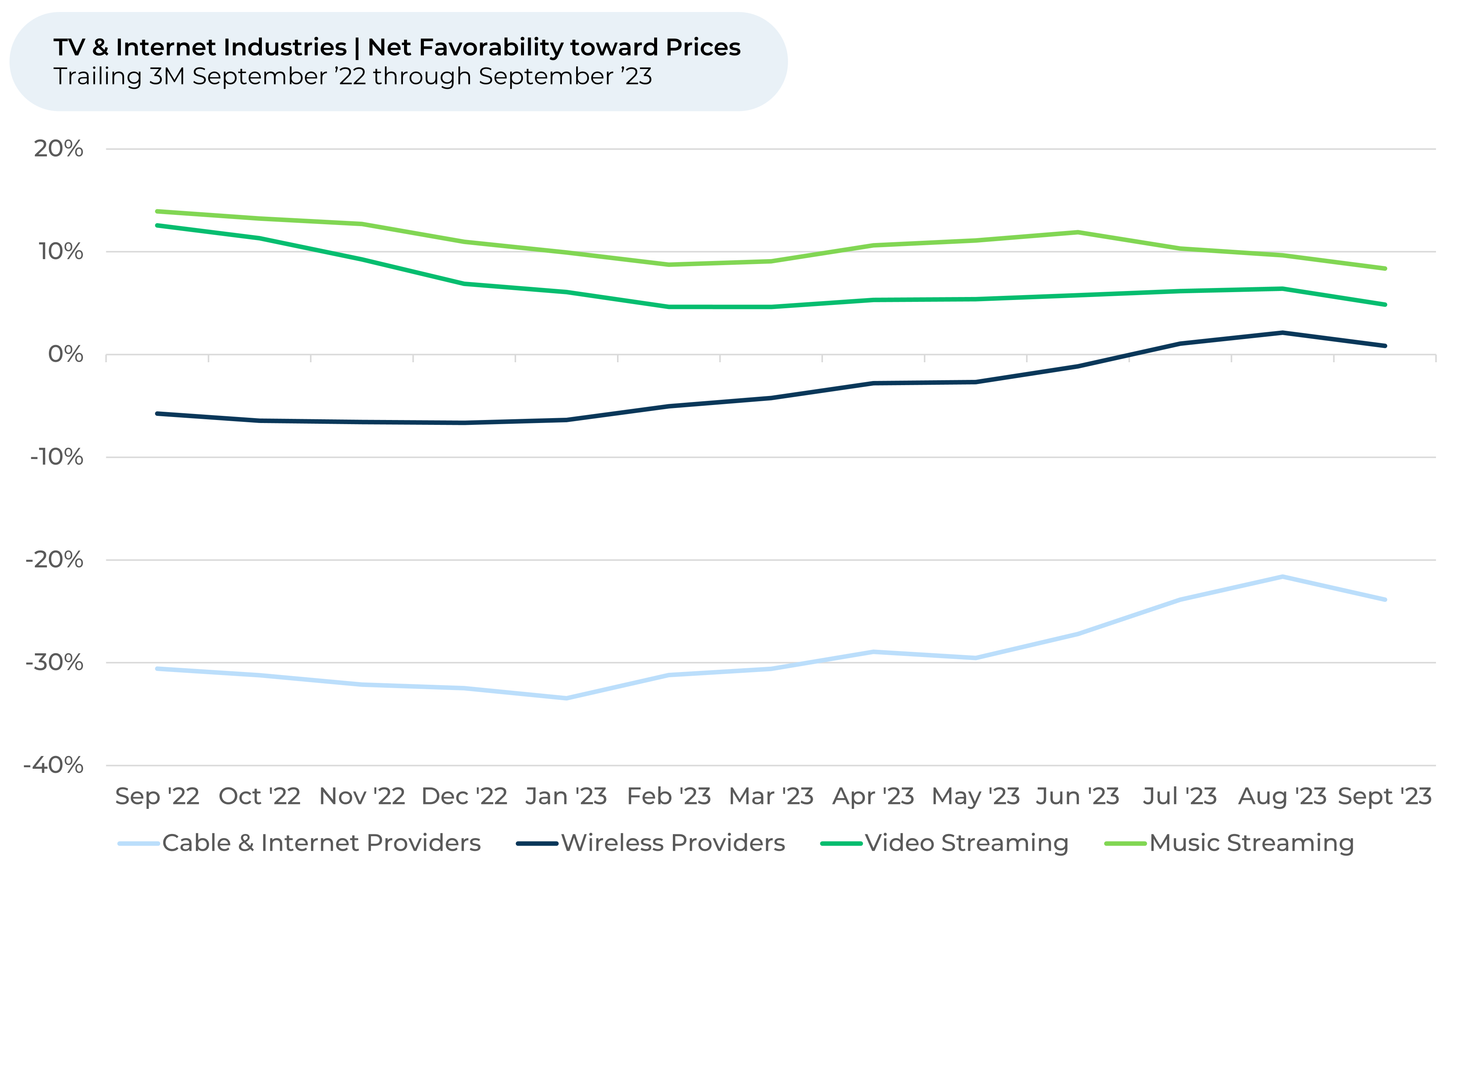
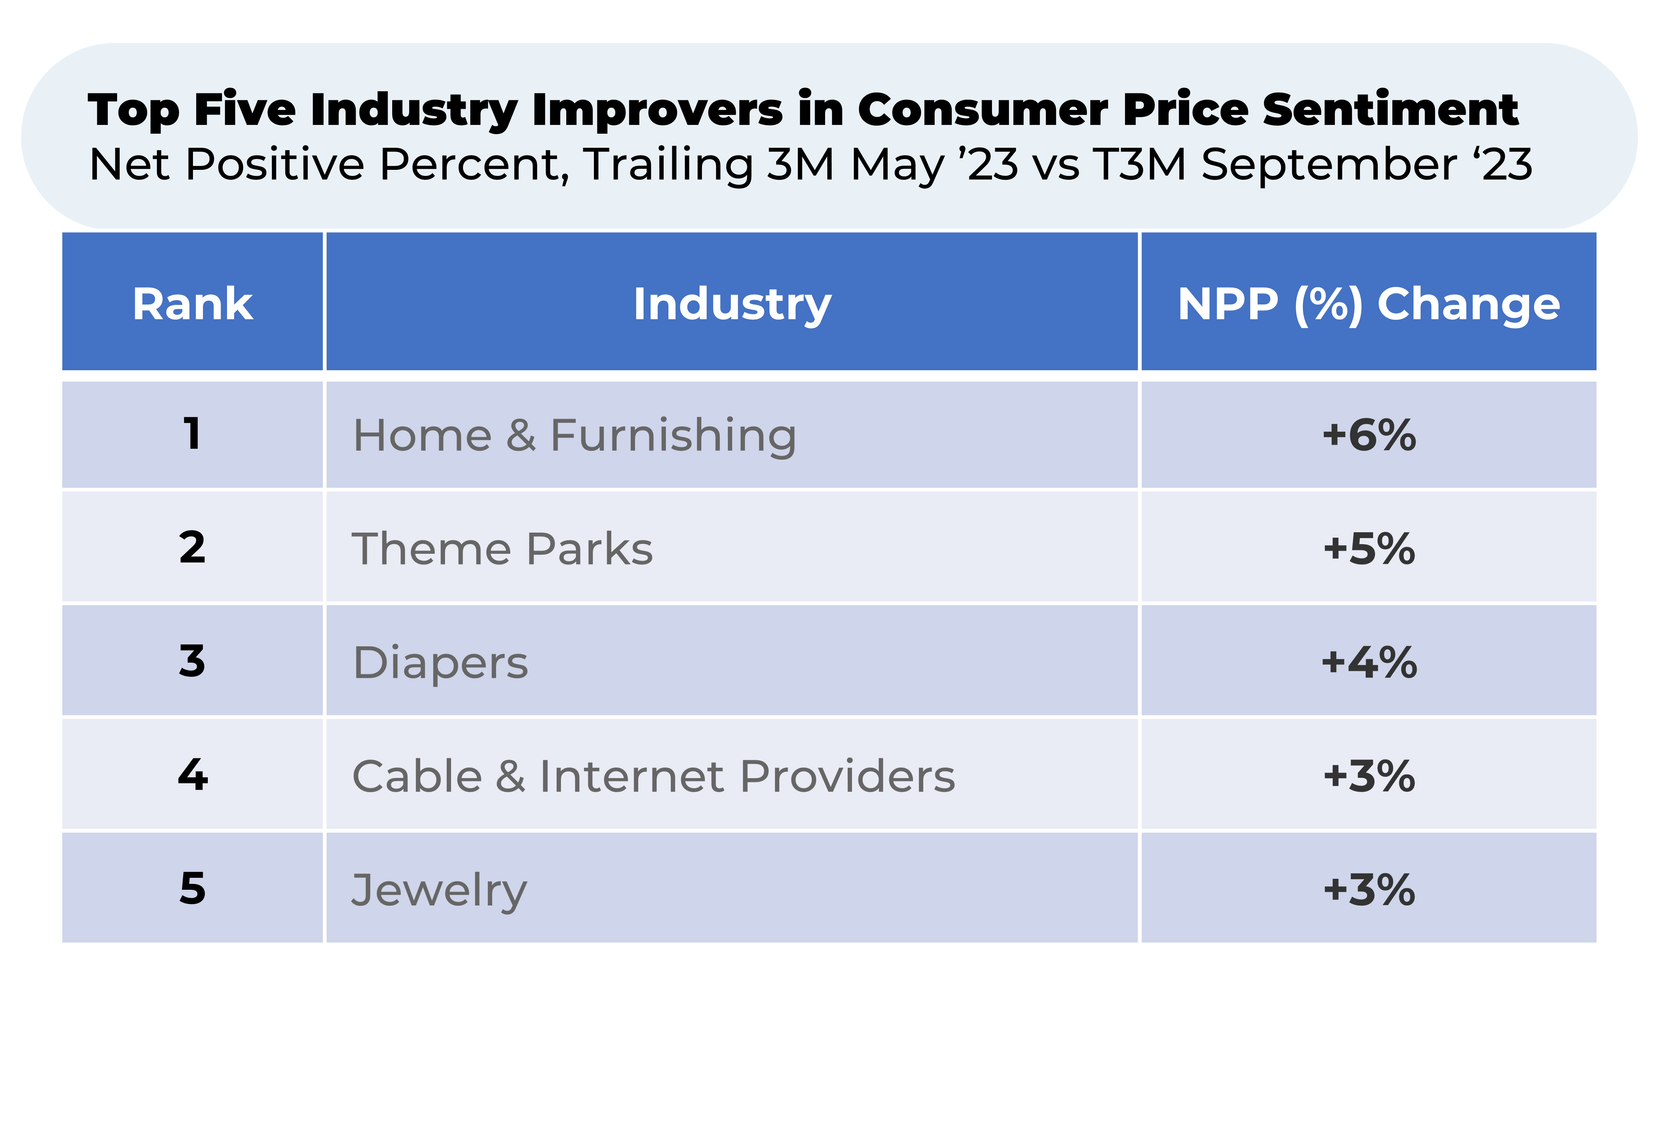
  • Streaming service prices have gotten so high that customers are warming to cable. While viewers still dislike the cost of cable far more than streaming, they feel cable prices are improving (net favorability up 3% since May). Loyalty Intent³ for cable and internet providers is also up 8% over the last year. 
  • With summer vacationing over, travel costs are seemingly improving and supportive of strong demand during the holiday travel season. Over the past three months, travelers have been feeling happier about price of airlines (+2%), ride sharing (+2%), car rental (+2%), and theme parks (+5%). Travel Intent is generally up for these industries, indicating demand should be strong this upcoming holiday season. 
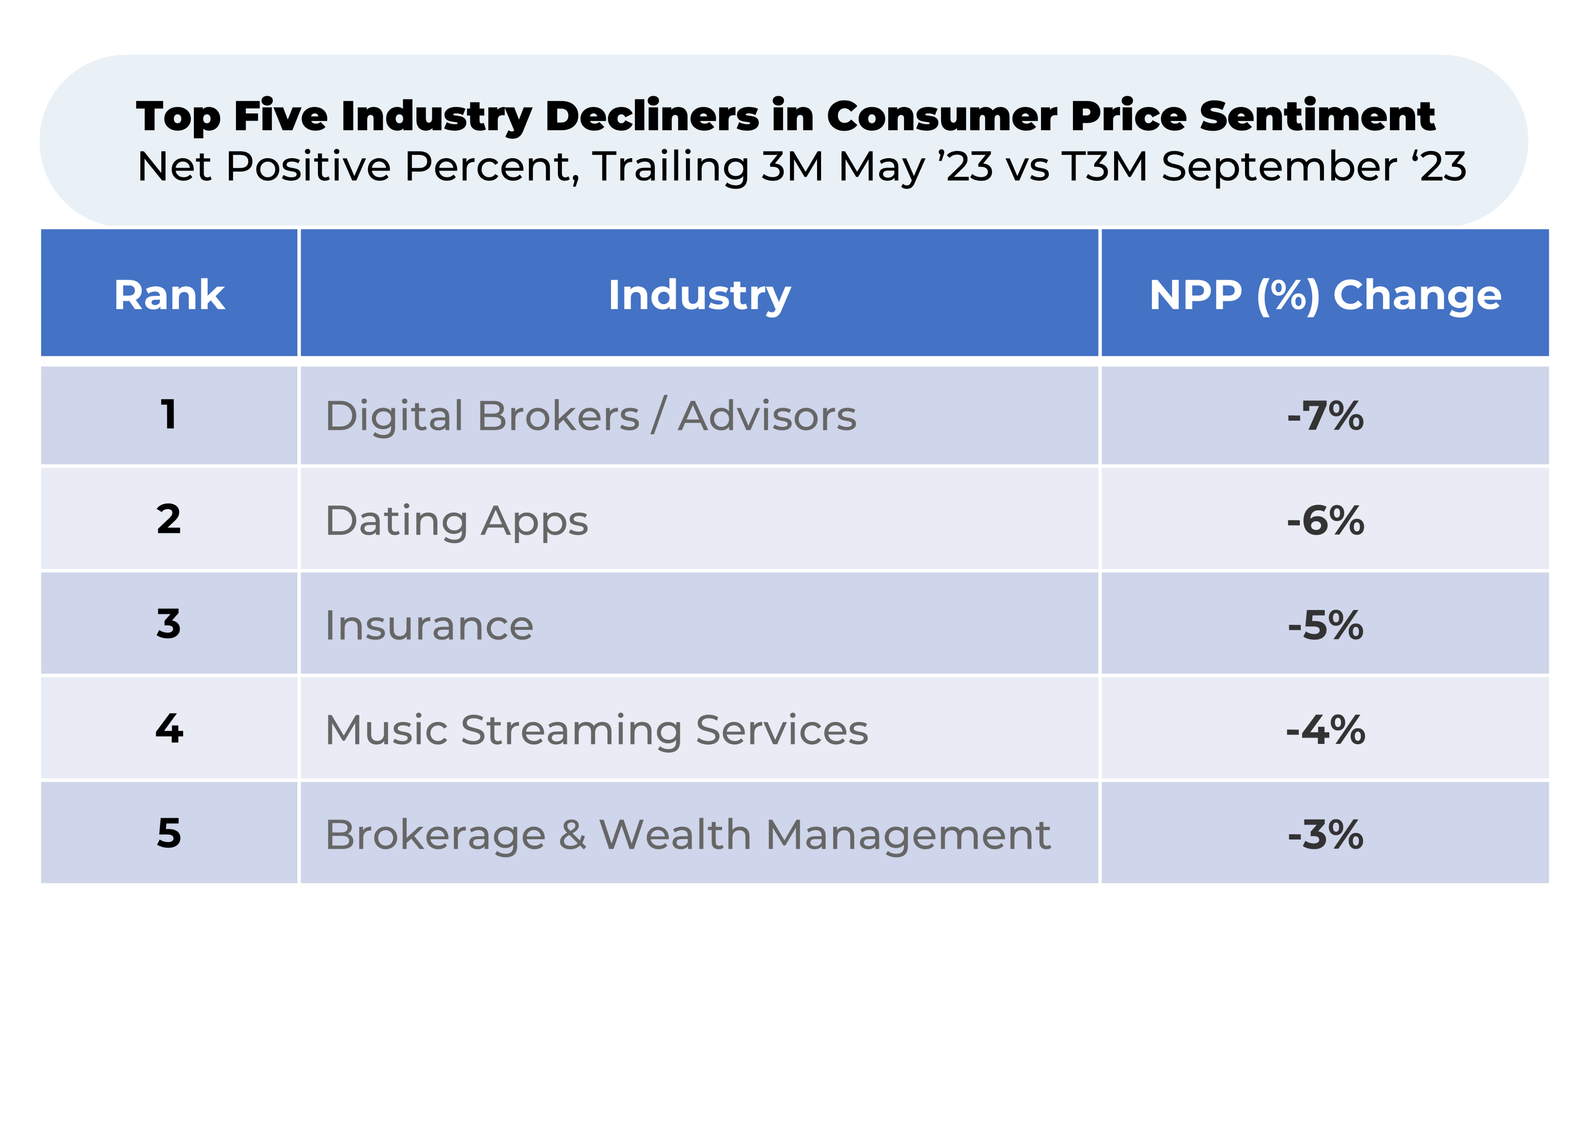
  • Meanwhile, prices in the financial sector are facing headwinds: in the last three months, insurance price sentiment has dropped by 5%, digital brokers/advisors have seen a 7% decline, and brokerage & wealth management is down by 3%.
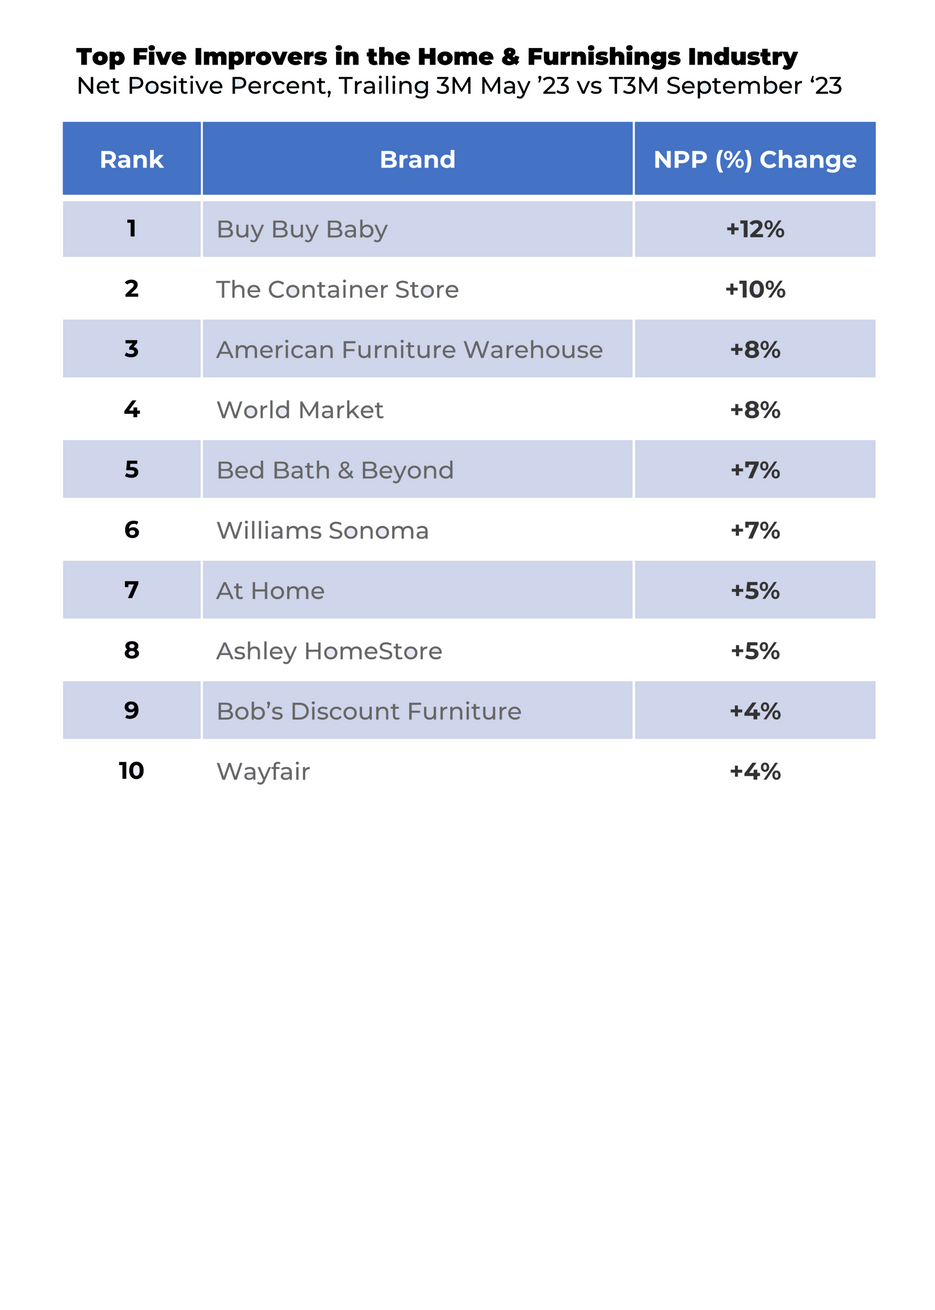
  • The biggest price perception gainer is the home & furnishings industry, up 6% since May. Bankruptcy filings from Bed Bath & Beyond and Buy Buy Baby led to price competition across the industry. 


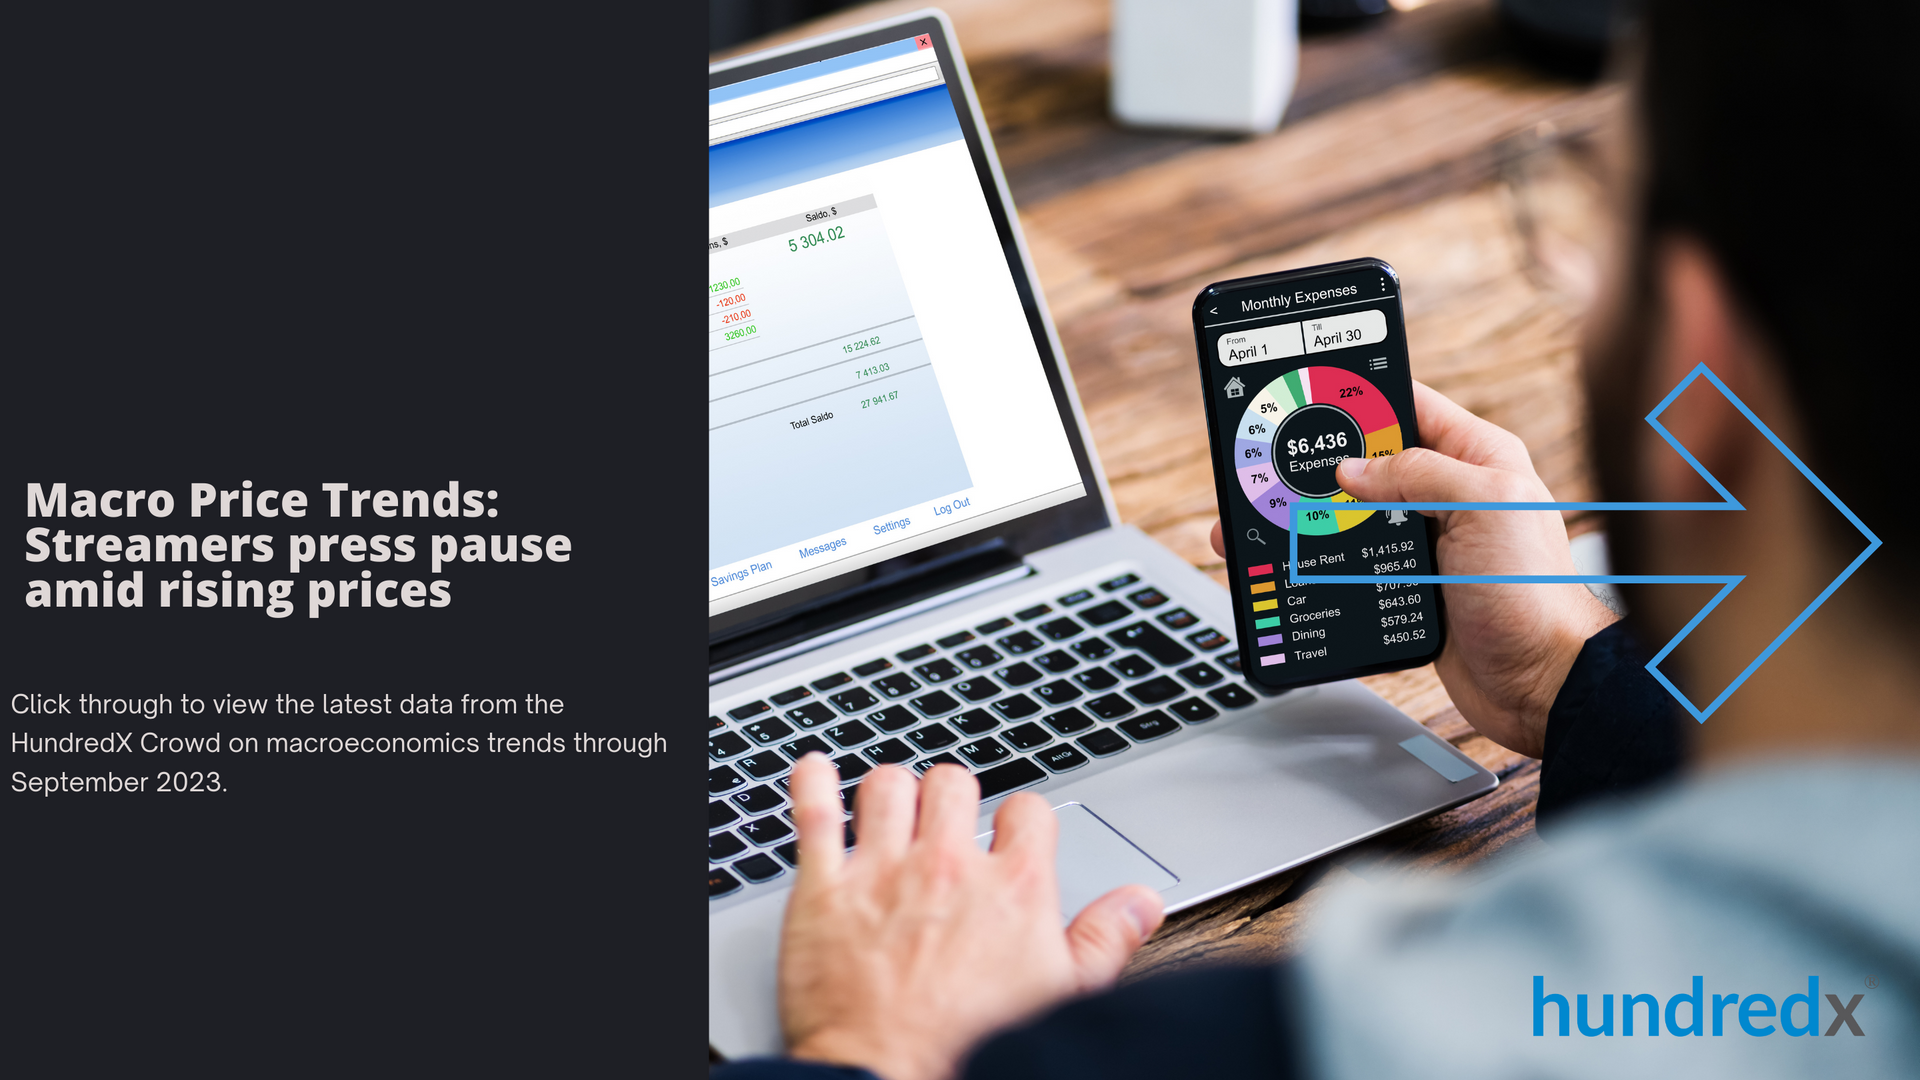
  • A man is holding a cell phone in front of a laptop computer.

    Slide title

    Write your caption here
    Button
  • A line graph showing the price of a commodity over a period of time.

    Slide title

    Price sentiment dipped 3% from July through September, reversing an improvement from

    May through July and highlighting inflation's persistence.

    Button
  • A line graph showing the number of people in each month.

    Slide title

    HundredX’s Purchase Intent Index (aggregates industries across our coverage) remained stable in September, indicating consumer demand outlook is pretty unchanged despite stubborn inflation. 

    Button
  • A line graph showing the price of disposable personal items.

    Slide title

    Disposable income growth (along with falling inflation) appears to be driving improving price sentiment over the last year. 

    Button
  • A graph showing a slope of a line going up and down.

    Slide title

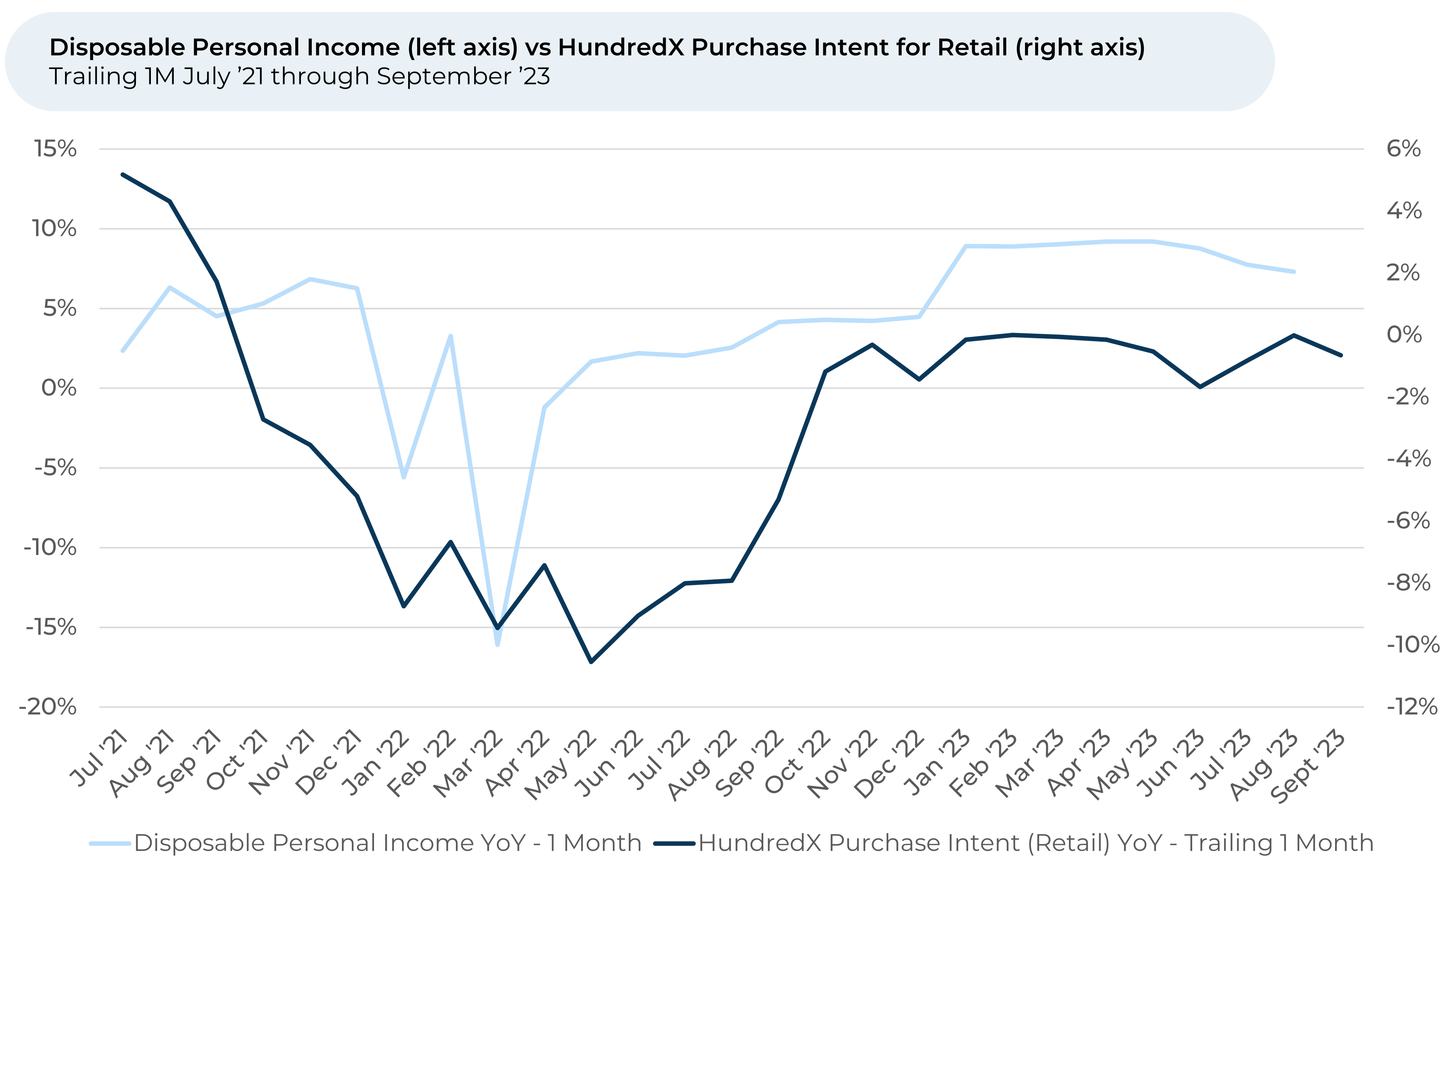
    Purchase Intent for the retail sector has stayed within a tight range since October 2022.

    Steady disposable personal income growth seems to be supporting resilient consumer

    spending in the retail sector.

    Button
  • A line graph showing a percentage of people watching tv.

    Slide title

    Over the past three months, customers felt happier about the price of cable & internet providers

    (+3%) and wireless providers (+2%) but unhappier about video (-1%) and music (-4%) streaming

    services. Still, viewers are much happier about the cost of streaming services than cable.

    Button
  • A table showing the top five industry improvers in consumer price sentiment

    Slide title

    Since May, price perception rose the most for the home &

    furnishing industry, followed by theme parks.

    Button
  • A table showing the top five improvements in the home and furnishings industry.

    Slide title

    Buy Buy Baby and Bed Bath & Beyond filed for bankruptcy earlier this year. As the

    retailers closed physical stores across the country, they offered major liquidation

    discounts. Competing brands, including The Container Store, began accepting the

    now defunct Bed Bath & Beyond coupons, while other brands seemed to cut

    prices around the time of Bed Bath & Beyond closure in late April.

    Button
  • A table showing the top five industry decliners in consumer price sentiment

    Slide title

    Finance and digital industries top the list of deepest price perception

    decliners. Digital brokers, the mix between the two industries, fell

    the most since May.

    Button
  • A table showing the top five declines in the streaming video and music.

    Slide title

    Most music and video streaming services raised prices in 2023. Notable mentions

    include YouTube TV (saw a 12% increase), Spotify (saw its first increase in 12

    years), Disney+ (up 27% for the ad-free plan).

    Button

Please contact our team for a deeper look at HundredX's data insights into the broader economy or specific sectors, industries or demographic groups.

  1. All metrics presented, including Net Purchase (Purchase Intent) and Net Positive Percent / Favorability, are presented on a trailing three-month basis unless otherwise noted.
  2. HundredX measures Net Favorability towards a driver of customer satisfaction as Net Positive Percent (NPP), which is the percentage of customers who view a factor as a positive (reason they liked the products, people, or experiences) minus the percentage who see the same factor as a negative.
  3. Usage Intent represents the percentage of customers who expect to use that brand/service over the next 12 months, minus those that intend to use less. Loyalty Intent is the percentage of customers who plan to keep using the service minus the percentage who intend to cancel. We find businesses that see Intent trends gain versus the industry or peers have often seen revenue growth rates, margins, and/or market share also improve versus peers.

Share This Article

November 26, 2024
HundredX helps fill in the blanks left by traditional data providers
A stack of coins with the words consumer spending muted amid rising prices
November 7, 2024
Consumers are navigating still-high prices with resilience. HundredX analysis, based on millions of pieces of customer feedback from July 2021 through April 2023 across 3,200+ companies, indicates inflation remains persistent, but consumers are cautiously hanging on. New Consumer Price Index (CPI) data shows prices increased 3.4% in April from a year ago, compared to 3.5% in March, which highlights a slight easing in inflation month-to-month. Still, HundredX data shows that consumers still feel negative about prices in general, pointing to inflation’s stickiness and consumer frustrations over the consistently high prices of everyday goods. Generally, we’ve seen that changes to HundredX’s Price favorability index are typically inversely correlated with movement in the CPI levels (i.e., inflation) reported by the US government.
October 26, 2024
HundredX Announces Strategic Alliance with FGS Global
Share by: