Price hikes became a hot topic in the streaming wars over the last year, with nearly every major platform increasing prices during 2023. Netflix has frequently made headlines due to another round of price hikes in October, becoming the first streamer to charge over $20 per month for its premium option. It also began cracking down on password sharing. The series of changes has led Netflix’s Usage Intent to drop the most of any streaming platform in both the last three months and versus a year ago.
Ahead of streaming earnings this week, we share insights from “The Crowd” of real Netflix and streaming industry customers. Analyzing more than 100,000 pieces of customer feedback across 23 video streaming services since December 2022, we find:
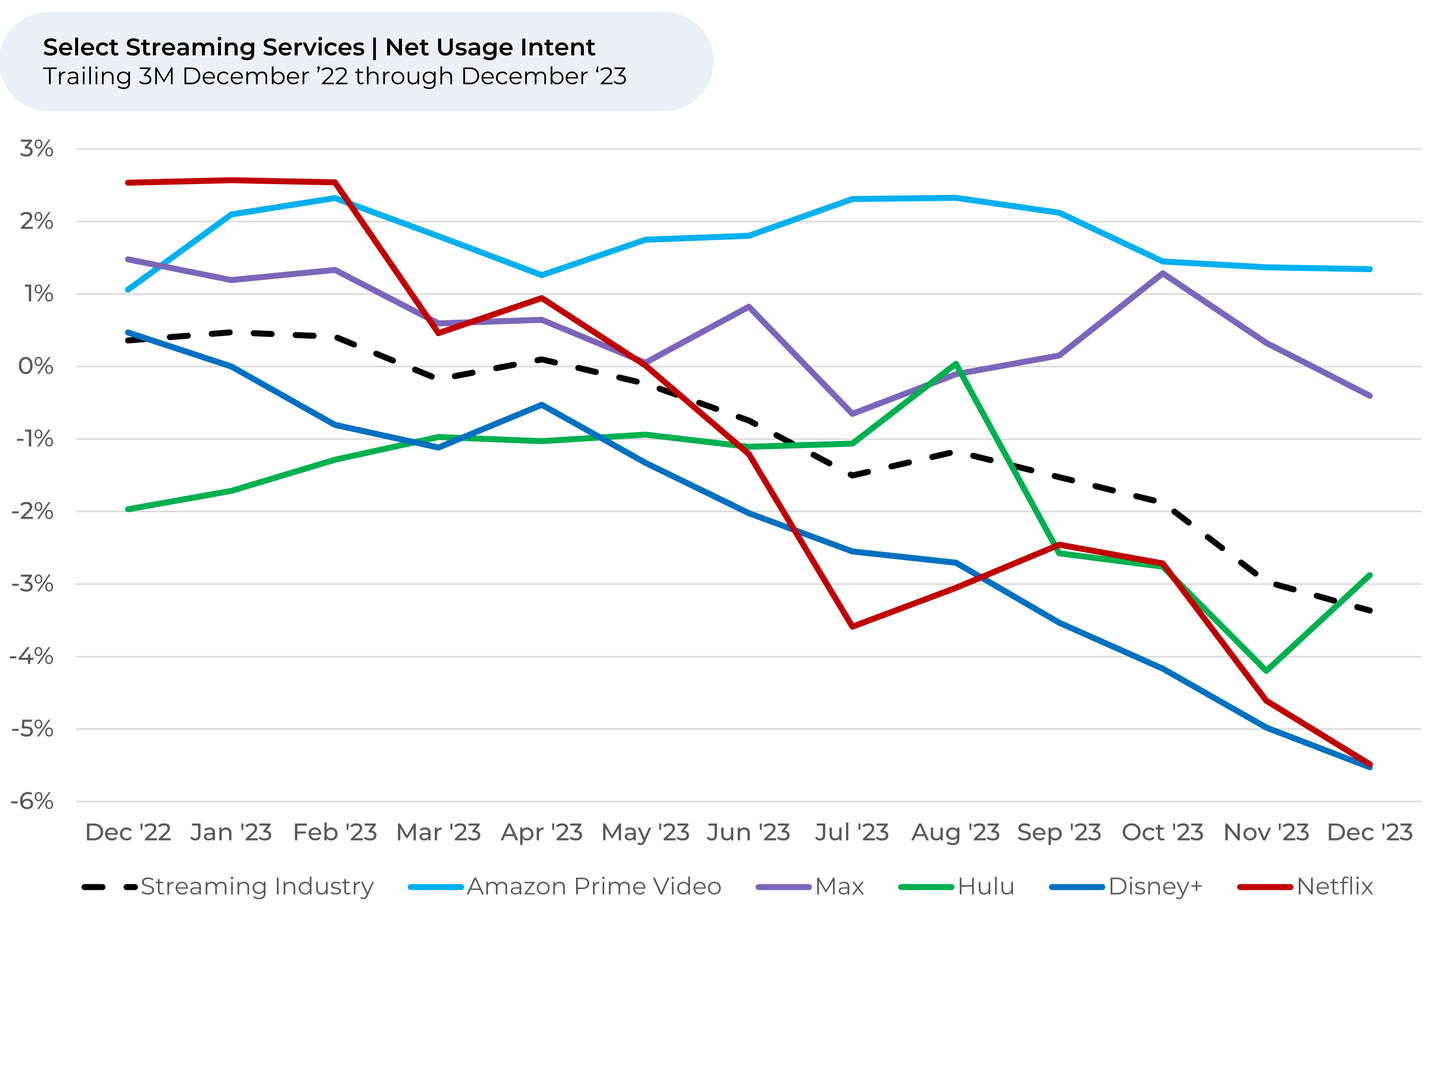
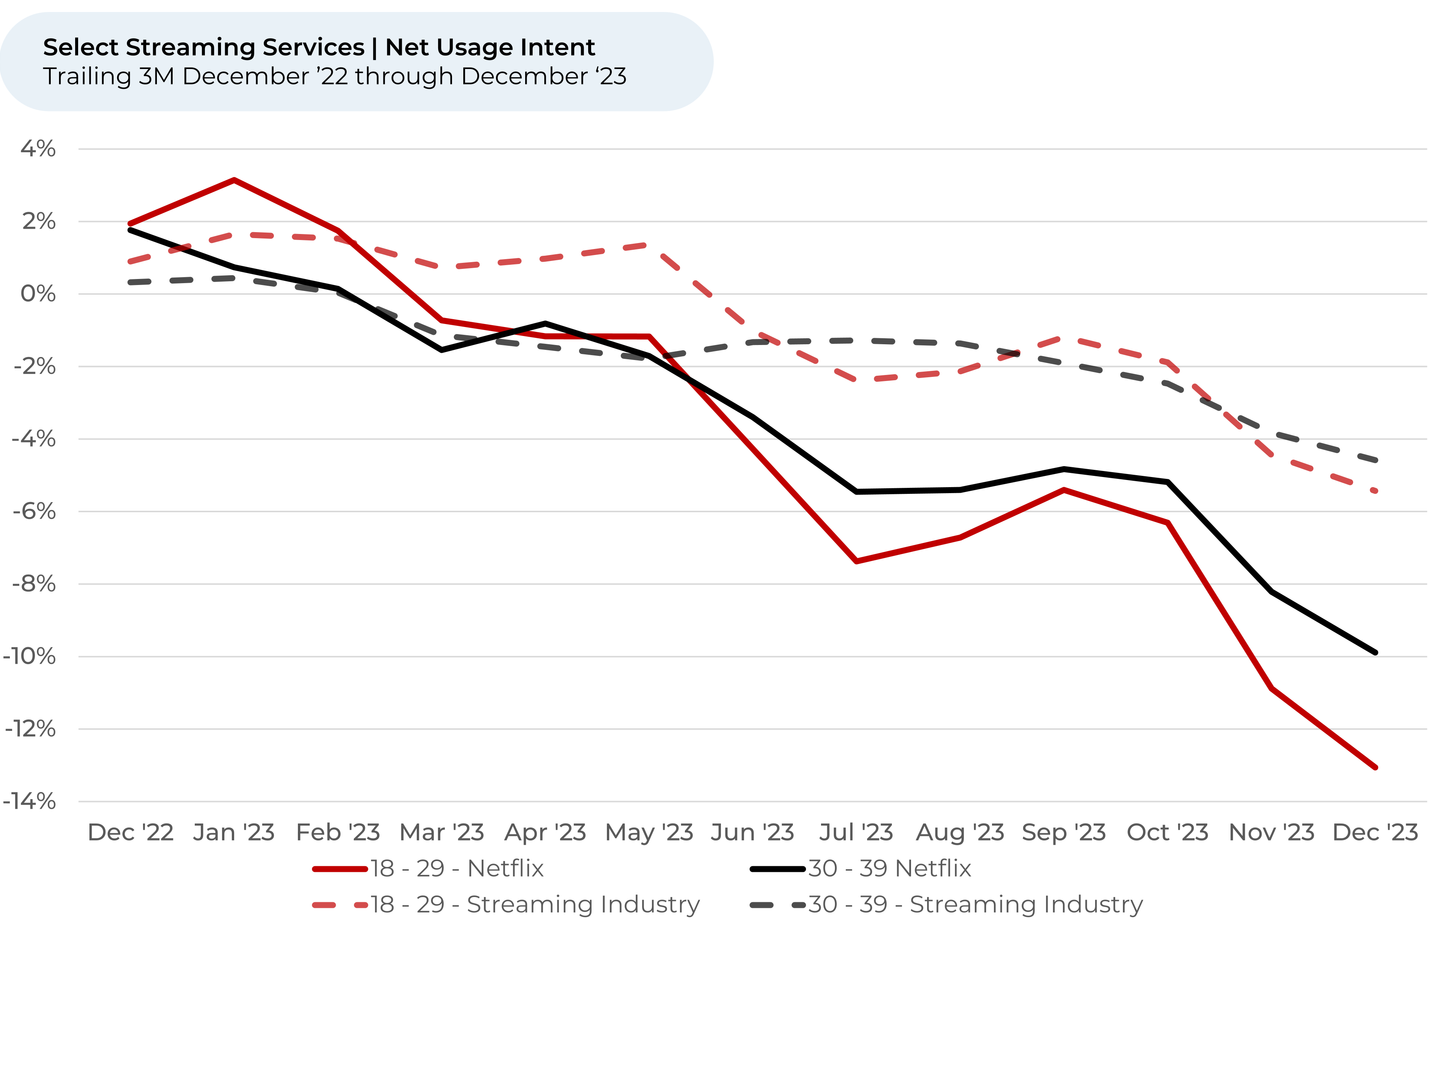
- Netflix’s Usage Intent1,2 fell 8% year-over-year and 3% over the last three months. The streaming industry overall fell by 4% and 2%, respectively. Amazon Prime Video, Hulu, and Max were the only streaming services where Usage Intent did not fall more than 1% during the final 3 months of 2023.
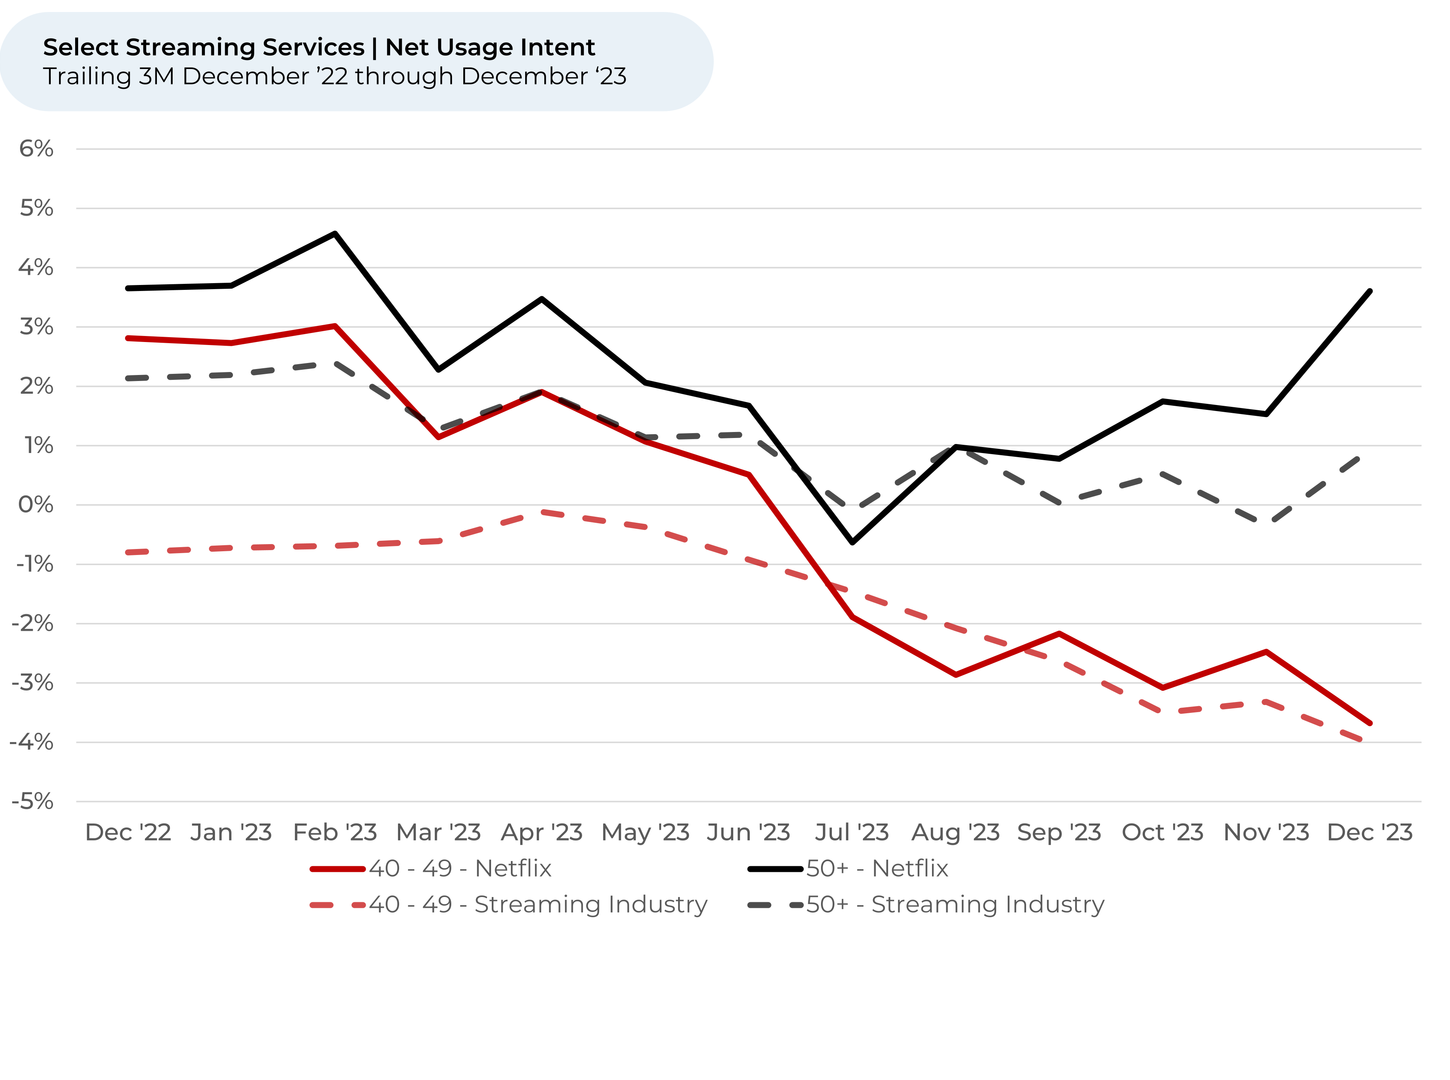
- Usage Intent trends were the worst with young streamers, who are presumably the most price sensitive. From September 2023 to December 2023, Industry Usage Intent fell by 4% for 18–29-year-olds, compared to -3% and -1% for 30-39 and 40-49 years old. Usage Intent actually improved by 1% for customers 50+ years old.
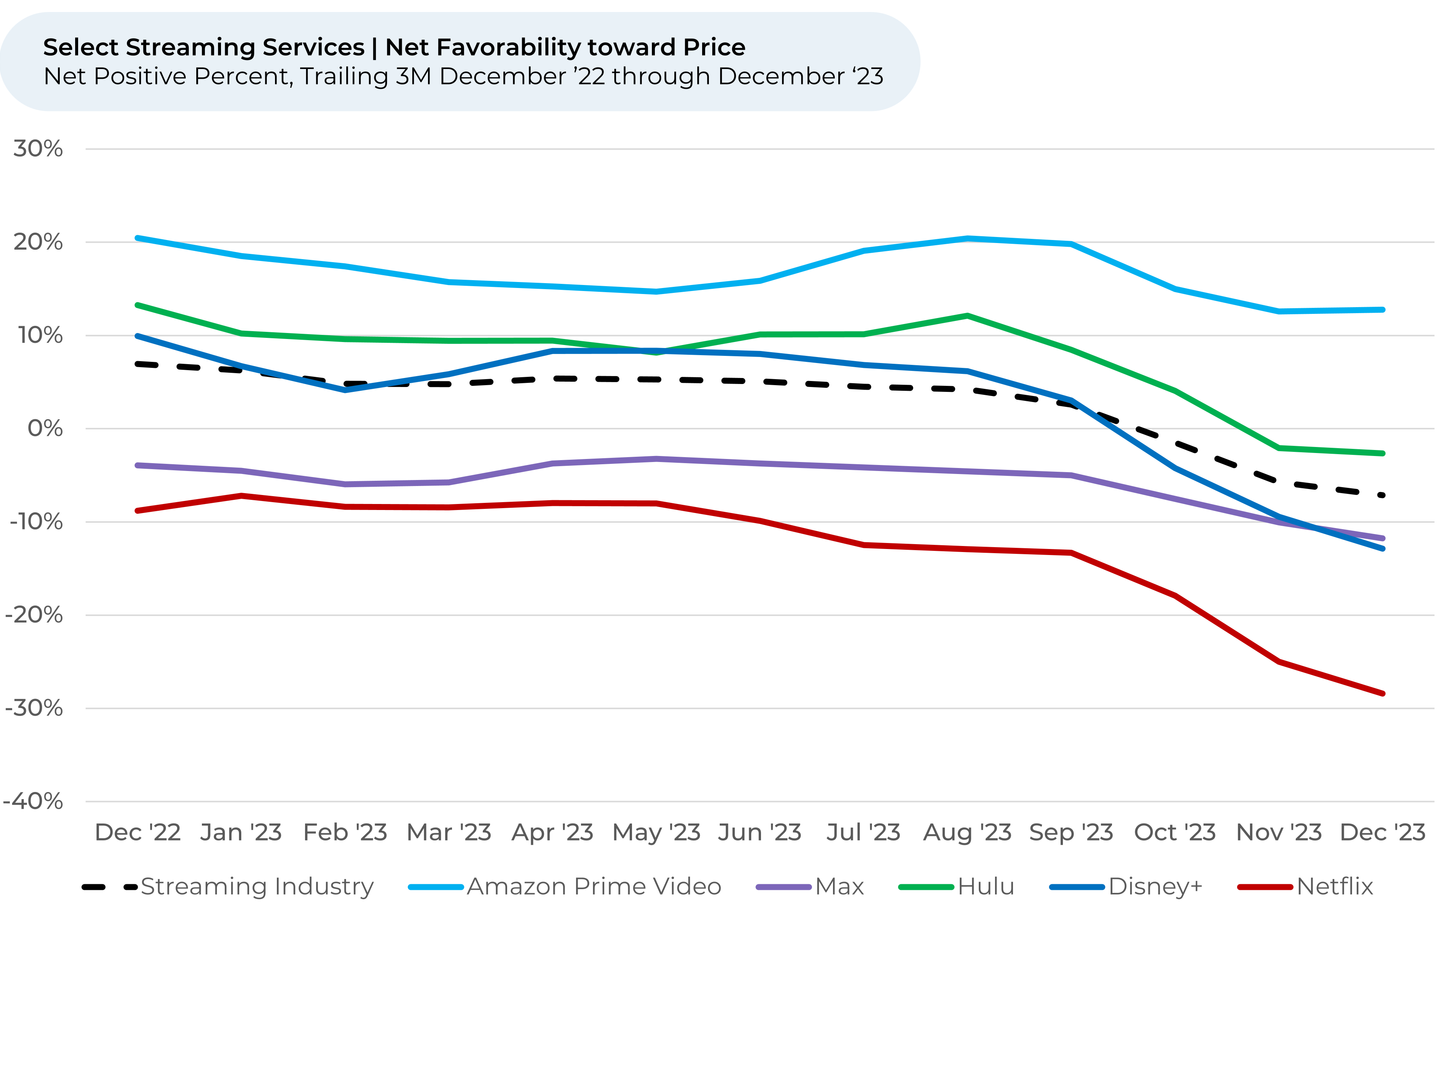
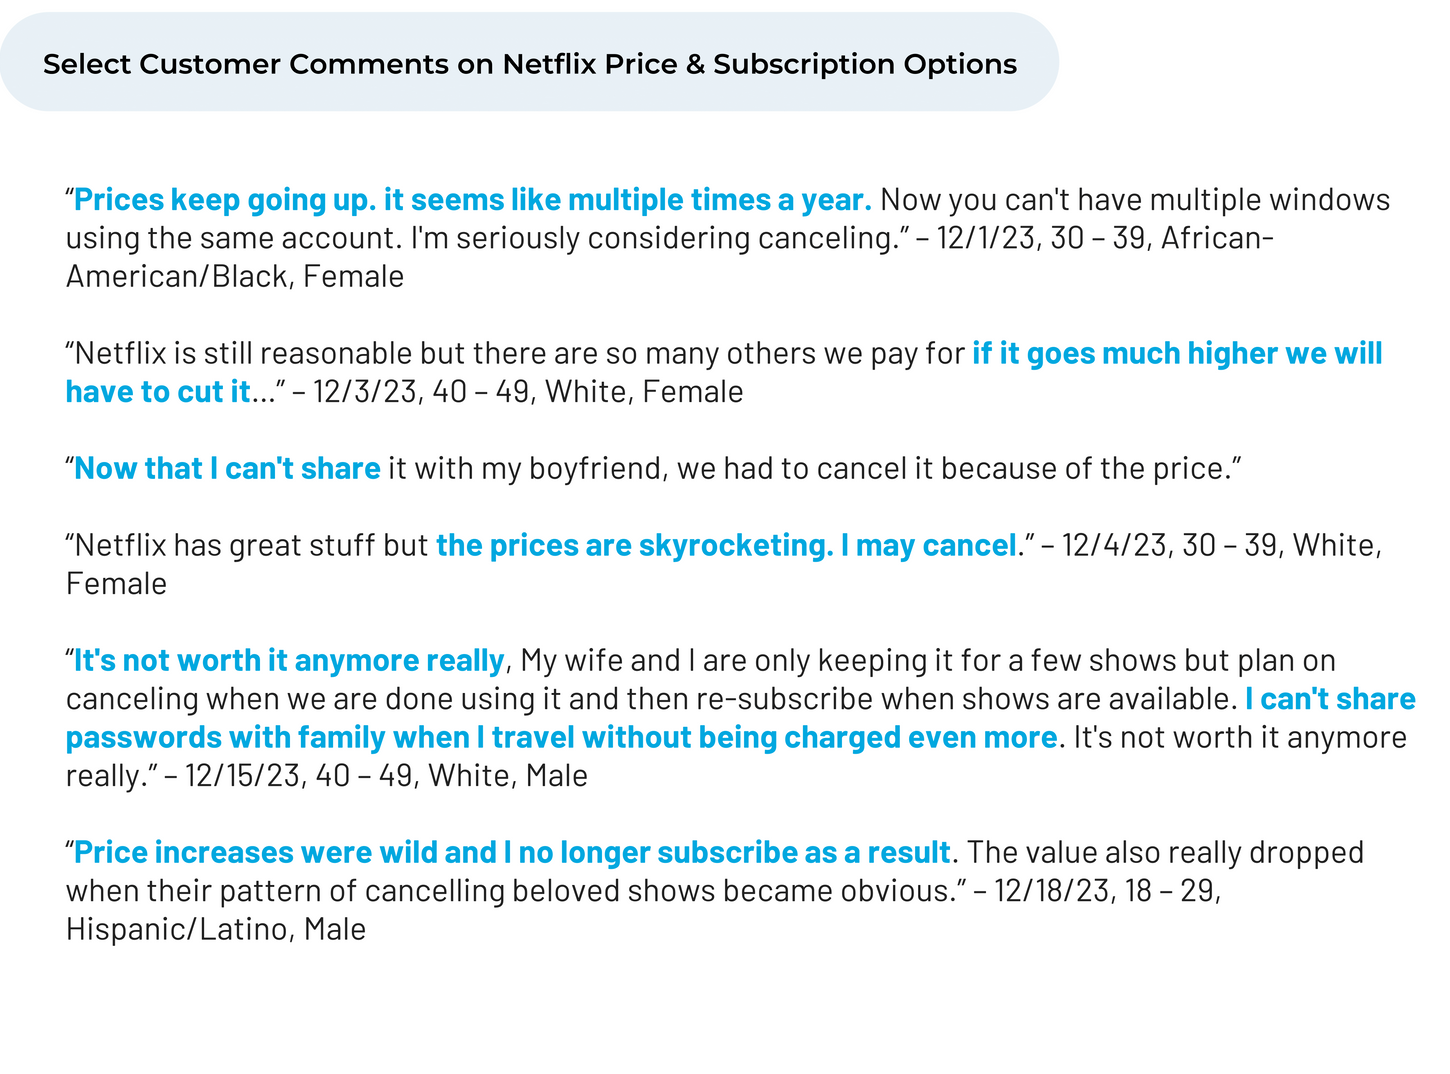
- Netflix customers’ perception3 of Price fell 15% in the last 3 months, the second worst in the industry only behind a 16% drop for Disney+. The entire streaming industry had a 10% decline.
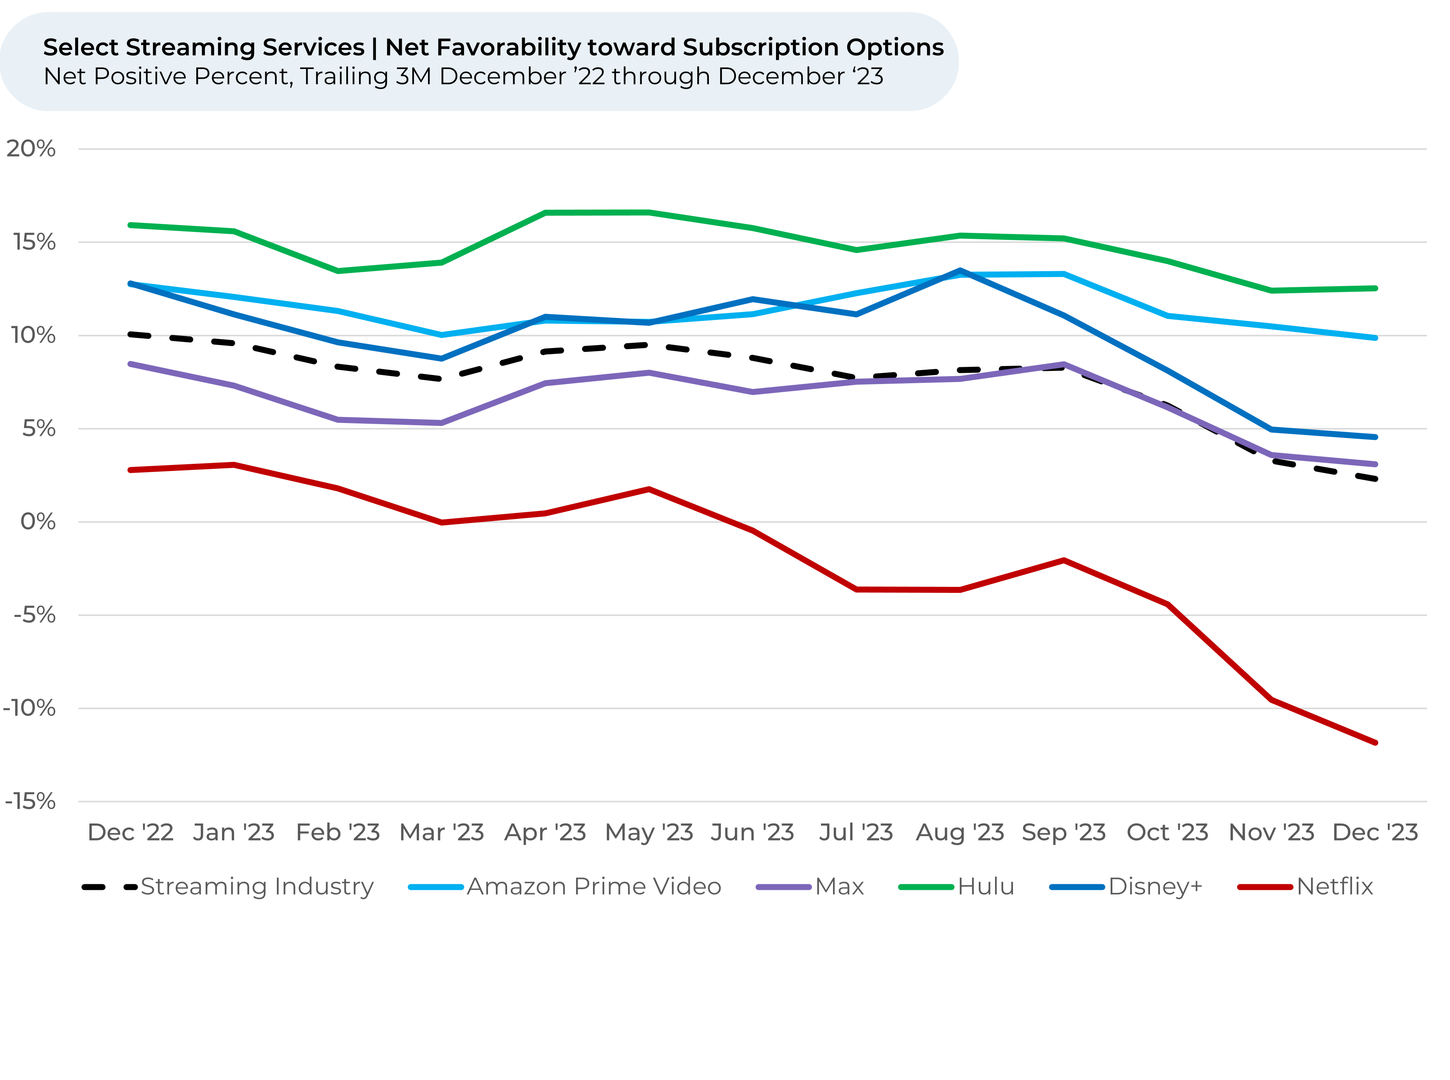
- Netflix customers’ perception of its subscription options has fallen more than the major platforms, with a 10% drop over the last 3 months and a 15% drop since December 2022.
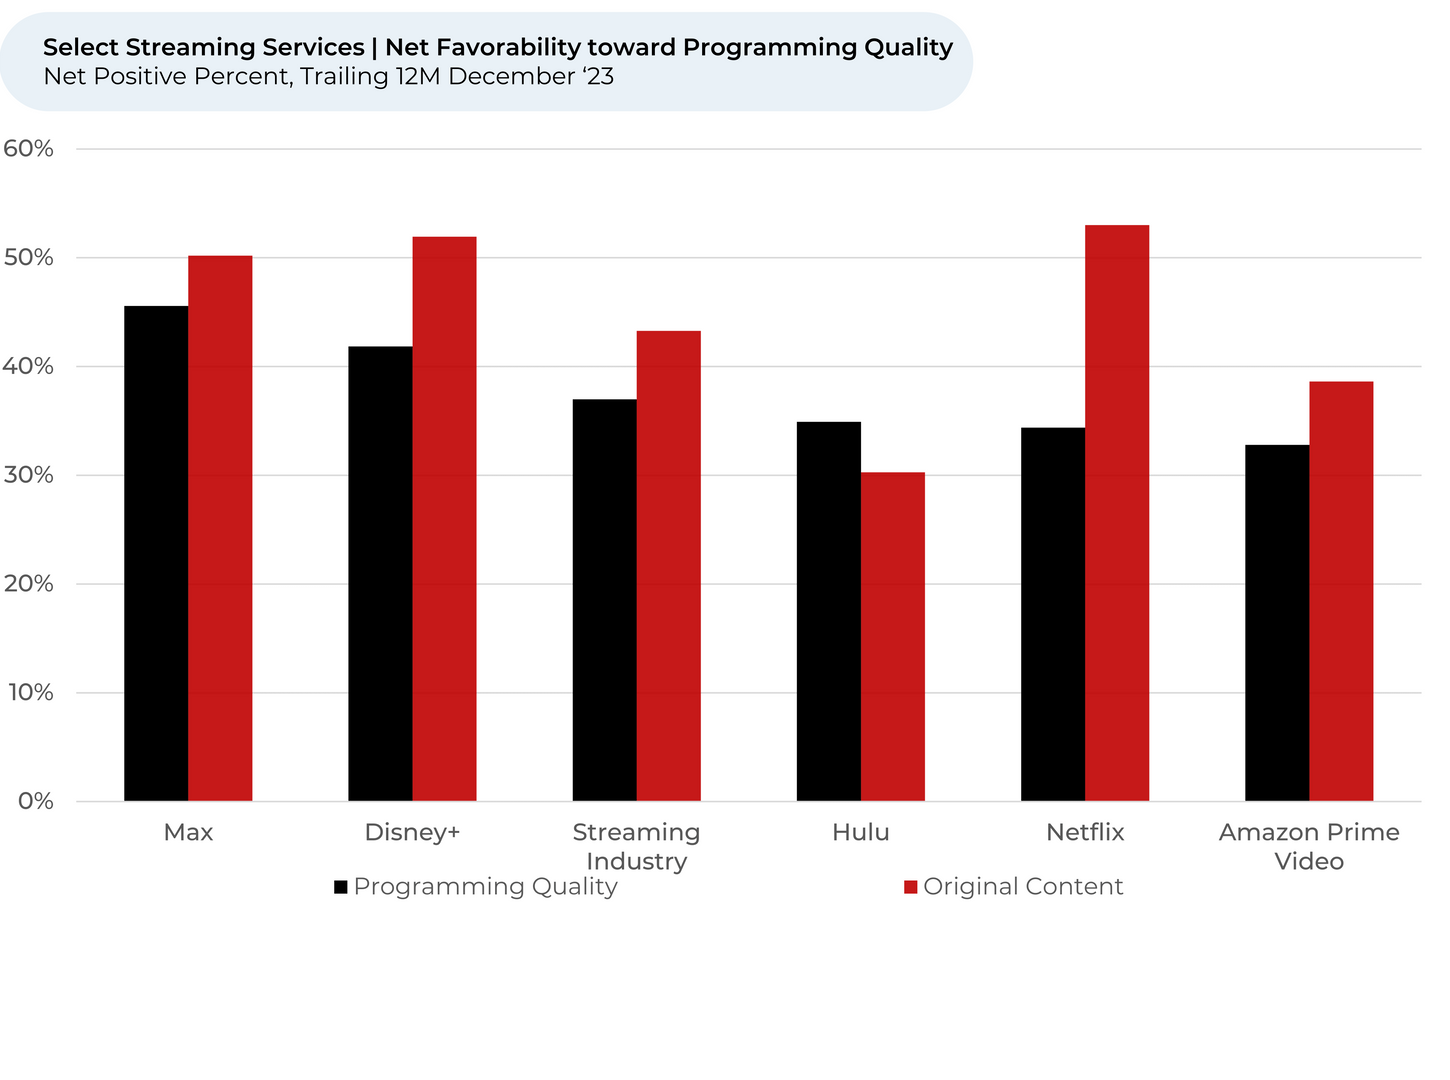
- Netflix lags behind most peers on customer satisfaction with its Programming Quality, a possible indication Netflix’s investments to grow its content library is not enough given its premium price.

Please contact our team for a deeper look at HundredX's video streaming data, which includes more than 260,000 pieces of customer feedback across 23 streaming services.
- All metrics presented, including Net Usage Intent (Usage Intent), and Net Sentiment / Net Positive Percent are presented on a trailing three-month basis unless otherwise noted.
- Usage Intent reflects the percentage of customers who plan to use a specific brand during the next 12 months, minus the percentage who plan to use less. We find businesses that see customer Intent trends gain versus the industry have often seen revenue growth rates, margins and/or market share also improve versus peers.
- HundredX measures customer perception or net favorability towards a driver of customer satisfaction as Net Positive Percent (NPP), which is the percentage of customers who view a factor as a positive (reason they liked the products, people, or experiences) minus the percentage who see the same factor as a negative.
Strategy Made Smarter
HundredX works with a variety of companies and their investors to answer some of the most important strategy questions in business:
- Where are customers "migrating"?
- What are they saying they will use more of in the next 12 months?
- What are the key drivers of their purchase decisions and financial outcomes?
Current clients see immediate benefits across multiple areas including strategy, finance, operations, pricing, investing, and marketing.
Our insights enable business leaders to define and identify specific drivers and decisions enabling them to grow their market share.
Please contact our team to learn more about which businesses across 75 industries are best positioned with customers and the decisions you can make to grow your brand’s market share.
####
HundredX is a mission-based data and insights provider. HundredX does not make investment recommendations. However, we believe in the wisdom of the crowd to inform the outlook for businesses and industries. For more info on specific drivers of customer satisfaction, other companies within 75+ other industries we cover, or if you'd like to learn more about using Data for Good, please reach out: https://hundredx.com/contact.
Share This Article