Ozempic once dominated the headlines, but GLP-1 competitor Mounjaro is winning over customers.
GLP-1 drugs, used for treating diabetes and aiding in weight loss, are relatively new on the market yet have surged in popularity over the last year. They're becoming so popular that J.P. Morgan estimates that 30 million people in the US may be using a GLP-1 drug by 2030. This statistic presents a significant potential for early drug creator Novo Nordisk (Ozempic, Wegovy), and perhaps an even bigger one for Eli Lilly (Mounjaro, Zepbound).
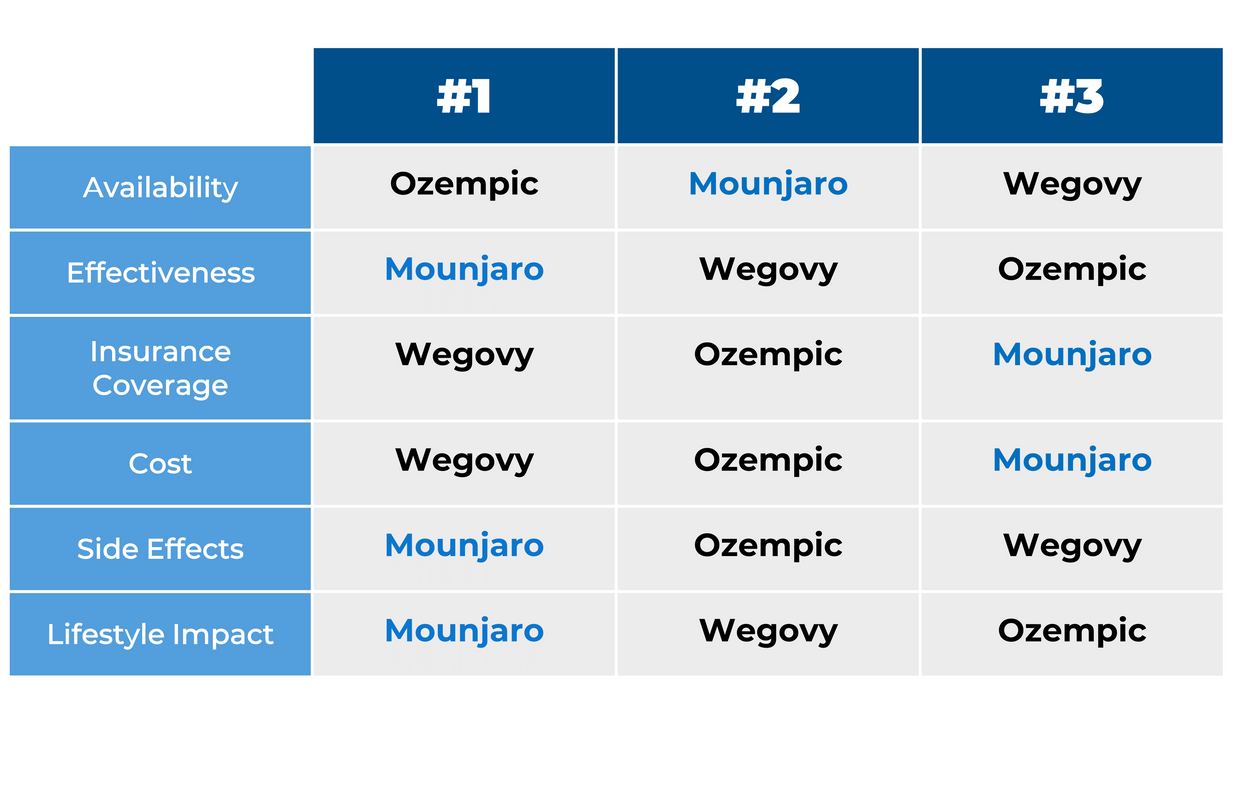
HundredX data indicates Eli Lilly is in a position to win over Novo Nordisk as Mounjaro's Usage Intent widens against the competition. Ozempic may have name recognition, but customers feel more positively about Mounjaro's effectiveness and lifestyle impact, even if they aren't excited about its high price.
Examining 1,500 pieces of customer feedback across Mounjaro, Ozempic, and Wegovy, we find:
- GLP-1 users increasingly say they plan to use Mounjaro more, and Ozempic less. Mounjaro’s Usage Intent is up 19% since July, Wegovy’s is up 3%, and Ozempic has stayed within a tight range.
- Customers feel Mounjaro is more effective than competing drugs, but it’s harder to get. Mounjaro outperforms other GLP-1 drugs in effectiveness, lifestyle impact, and side effects. However, customers dislike its cost and availably more than competitors.


Please contact our team for a deeper look at HundredX's data on prescription medication, which includes more than 130,000 pieces of customer feedback across 206 medications.
- All metrics presented, including Net Usage (Usage Intent) and Net Positive Percent / Favorability, are presented on a trailing three-month basis unless otherwise noted.
- Usage Intent represents the percentage of customers who expect to use a medication more over the next 12 months, minus those who intend to use it less. We find businesses that see Usage Intent trends gain versus the industry or peers have often seen revenue growth rates, margins, and/or market share also improve versus peers.
- HundredX measures Net Favorability towards a driver of customer satisfaction as Net Positive Percent (NPP), which is the percentage of customers who view a factor as a positive (reason they liked the products, people, or experiences) minus the percentage who see the same factor as a negative.
Strategy Made Smarter
HundredX works with a variety of companies and their investors to answer some of the most important strategy questions in business:
- Where are customers "migrating"?
- What are they saying they will use more of in the next 12 months?
- What are the key drivers of their purchase decisions and financial outcomes?
Current clients see immediate benefits across multiple areas including strategy, finance, operations, pricing, investing, and marketing.
Our insights enable business leaders to define and identify specific drivers and decisions enabling them to grow their market share.
Please contact our team to learn more about which businesses across 80+ industries are best positioned with customers and the decisions you can make to grow your brand’s market share.
####
HundredX is a mission-based data and insights provider. HundredX does not make investment recommendations. However, we believe in the wisdom of the crowd to inform the outlook for businesses and industries. For more info on specific drivers of customer satisfaction, other companies within 75+ other industries we cover, or if you'd like to learn more about using Data for Good, please reach out: https://hundredx.com/contact.
Share This Article