Shein and Temu offer customers a seemingly unlimited number of styles at low, low costs. Sure, shipping from China to the US can take weeks and the clothing might not last as long as their more expensive counterparts, but shoppers have long put these issues aside to experience the joy of unboxing hauls on camera. That compromise may be coming to an end.
Shoppers are telling HundredX that the value of Shein and Temu products is slipping. They still like the prices, but increasingly say they dislike their quality. Customers are also souring on the brands’ values and trustworthiness in light of recent copyright, workplace, and sustainability issues, and are now indicating they plan to shop less at Shein and Temu than they used to.
Digging into the data, which includes more than 260,000 pieces of customer feedback on Fashion brands (including 6,200 pieces on Shein and Temu) over the past year, we find:
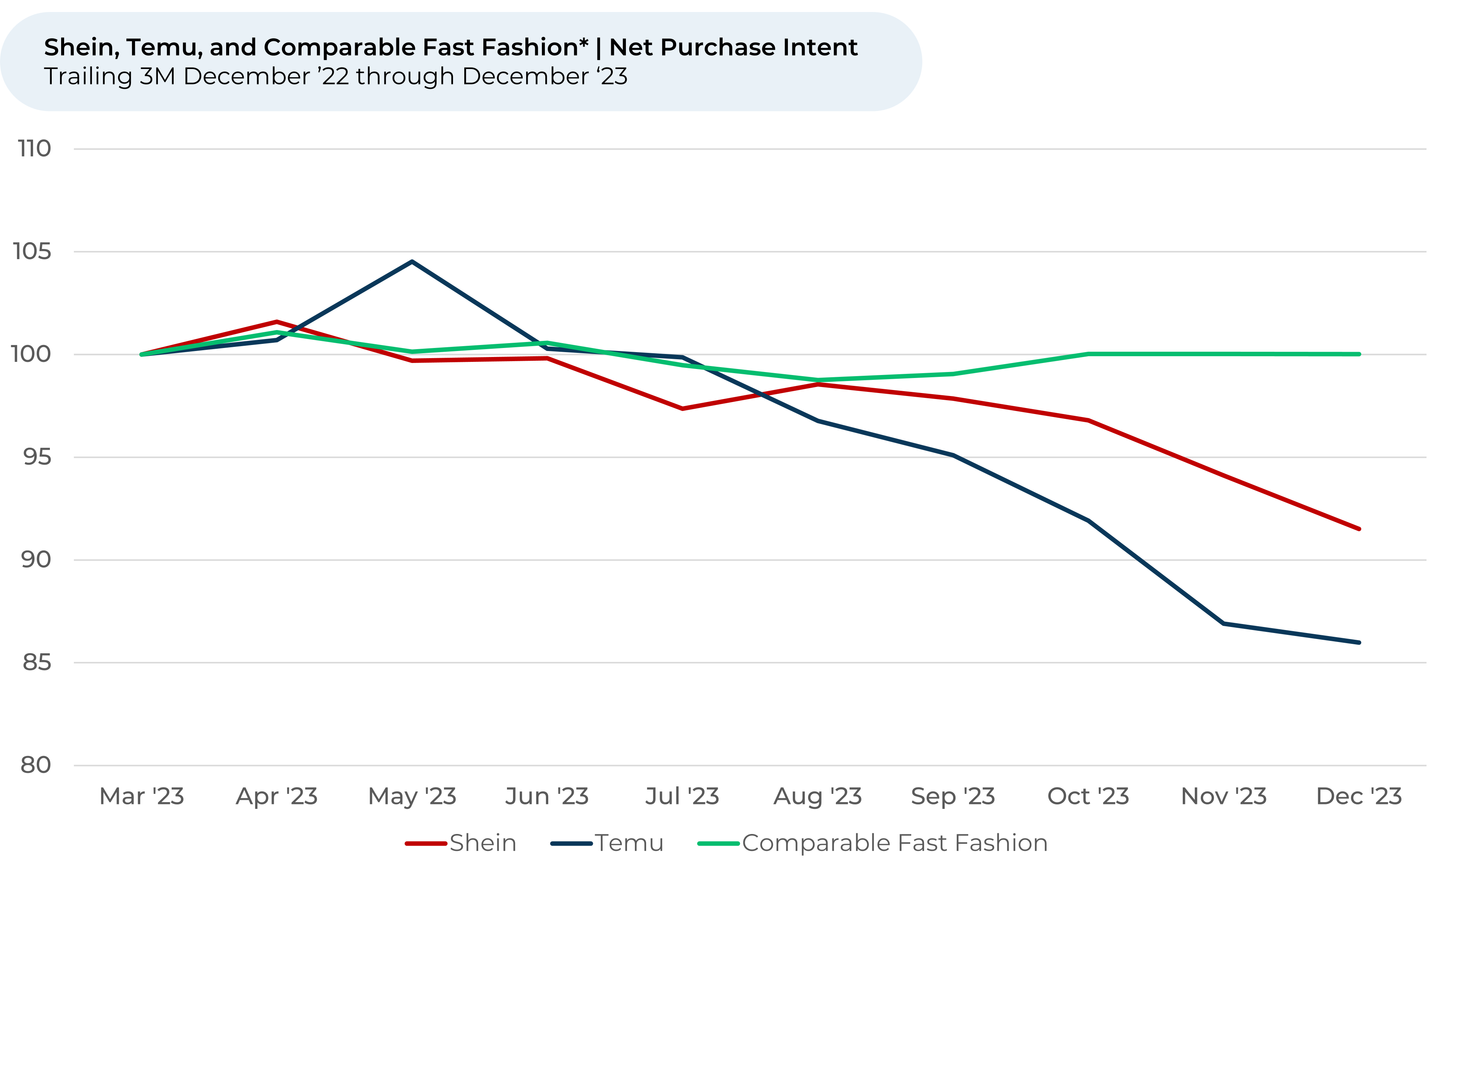
- Shoppers are saying they plan to purchase less from Shein and Temu. Purchase Intent ¹,² fell rapidly for Shein (-8%) and Temu (-14%) over the past six months. It’s down for all age groups, but sank more for shoppers over 40. Purchase Intent for comparable fast fashion brands³ remained relatively stable.
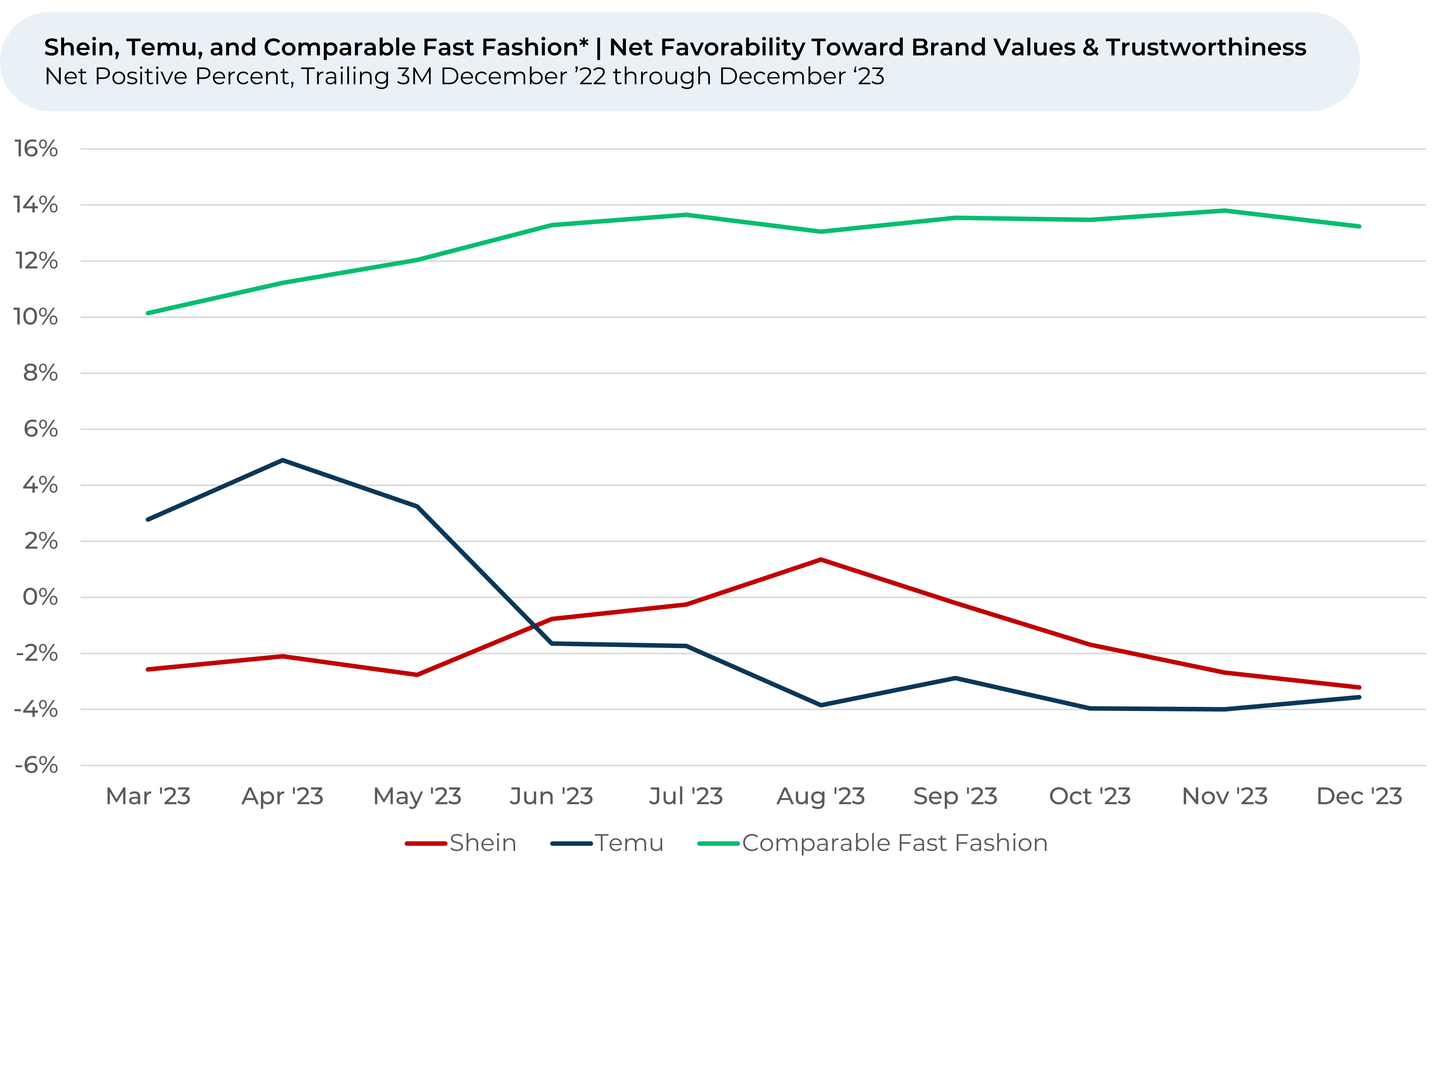
- Following a copyright lawsuit against Shein over the summer, perception⁴ towards Shein’s brand values and trustworthiness fell 4%. Temu meanwhile, is down 2% over the past six months.
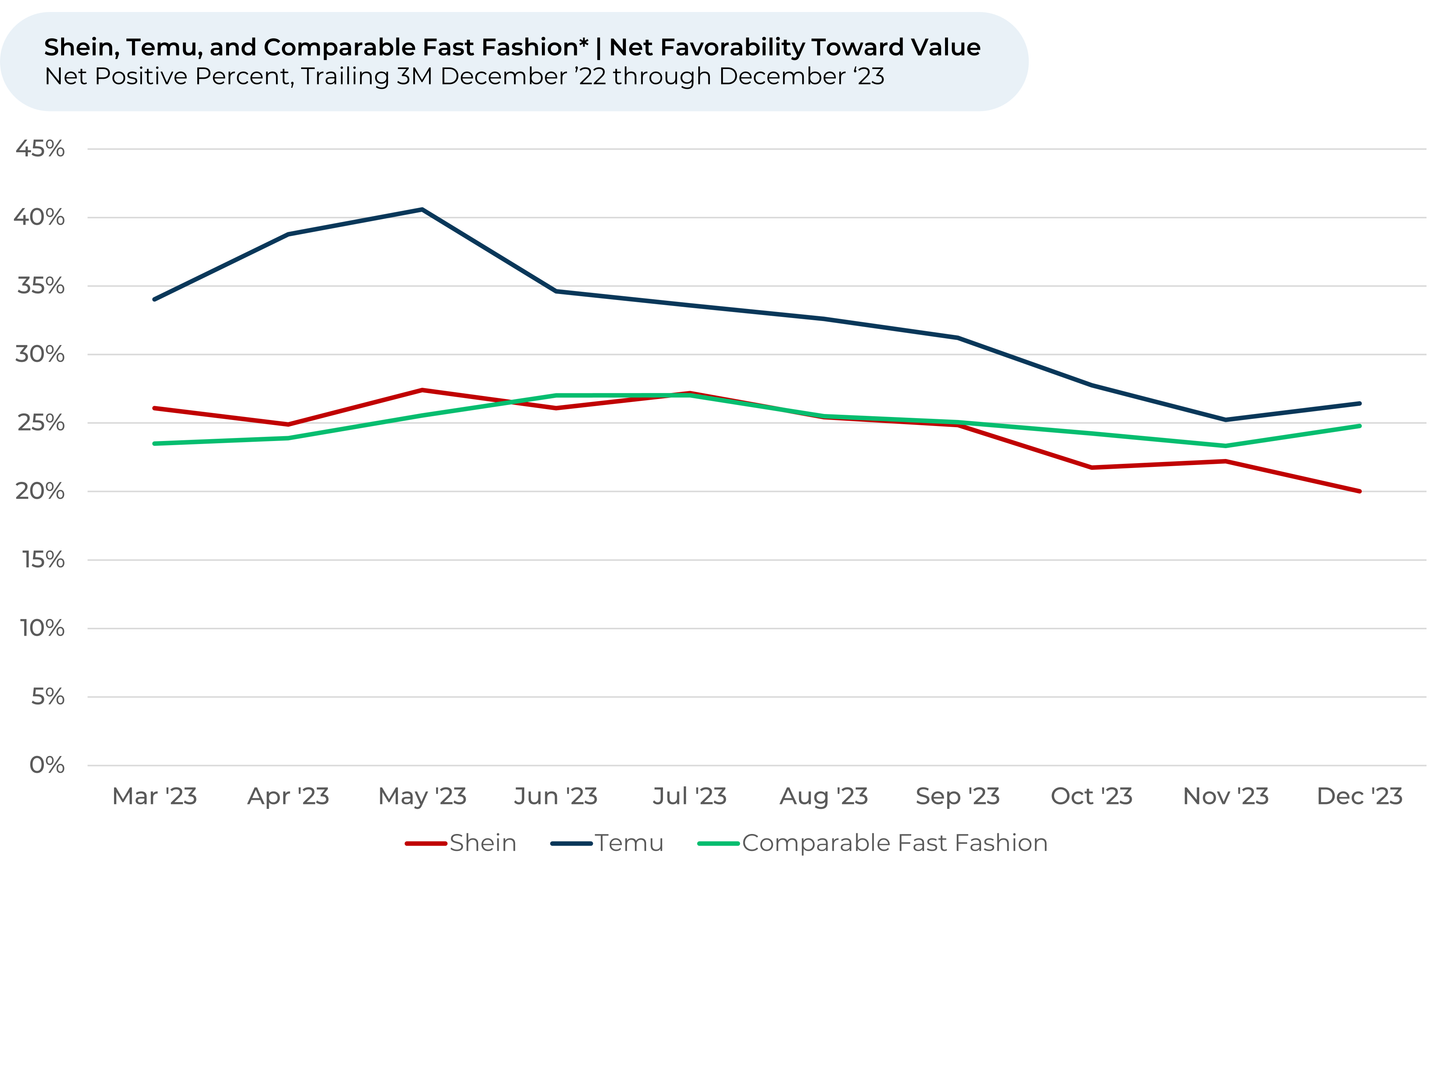
- Shopper perception toward value fell 6% for Shein and 8% for Temu over the past six months, while falling just 2% for comparable fast fashion brands.
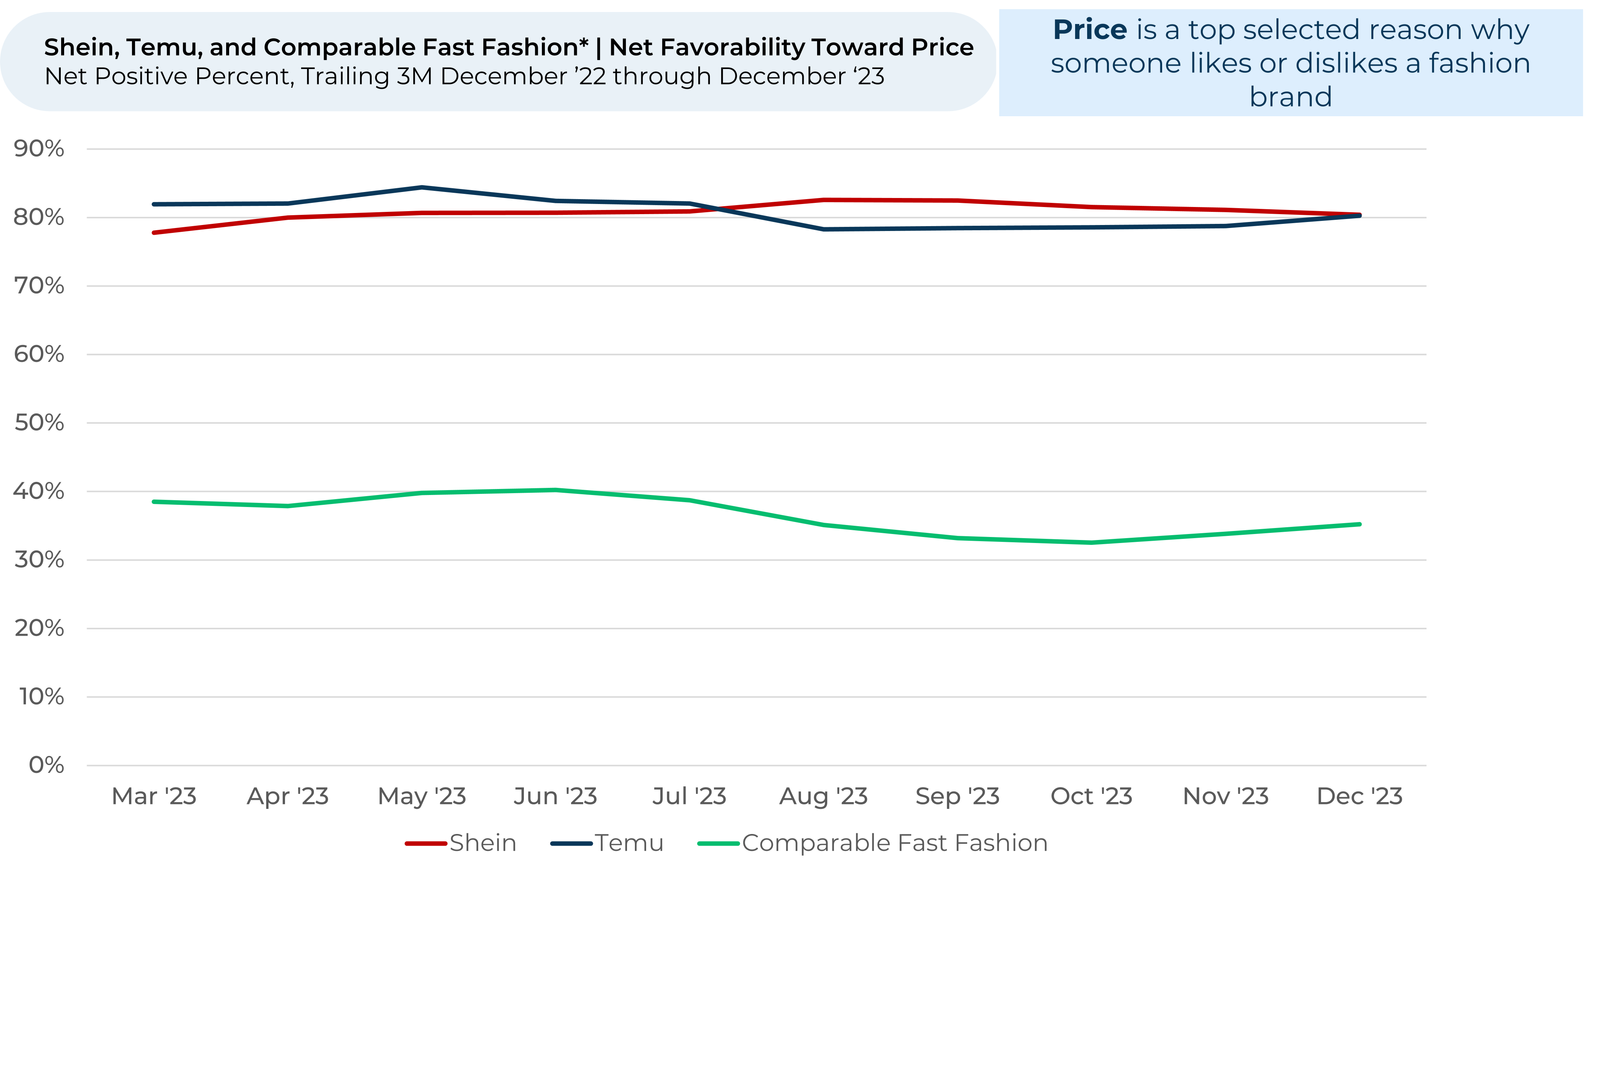
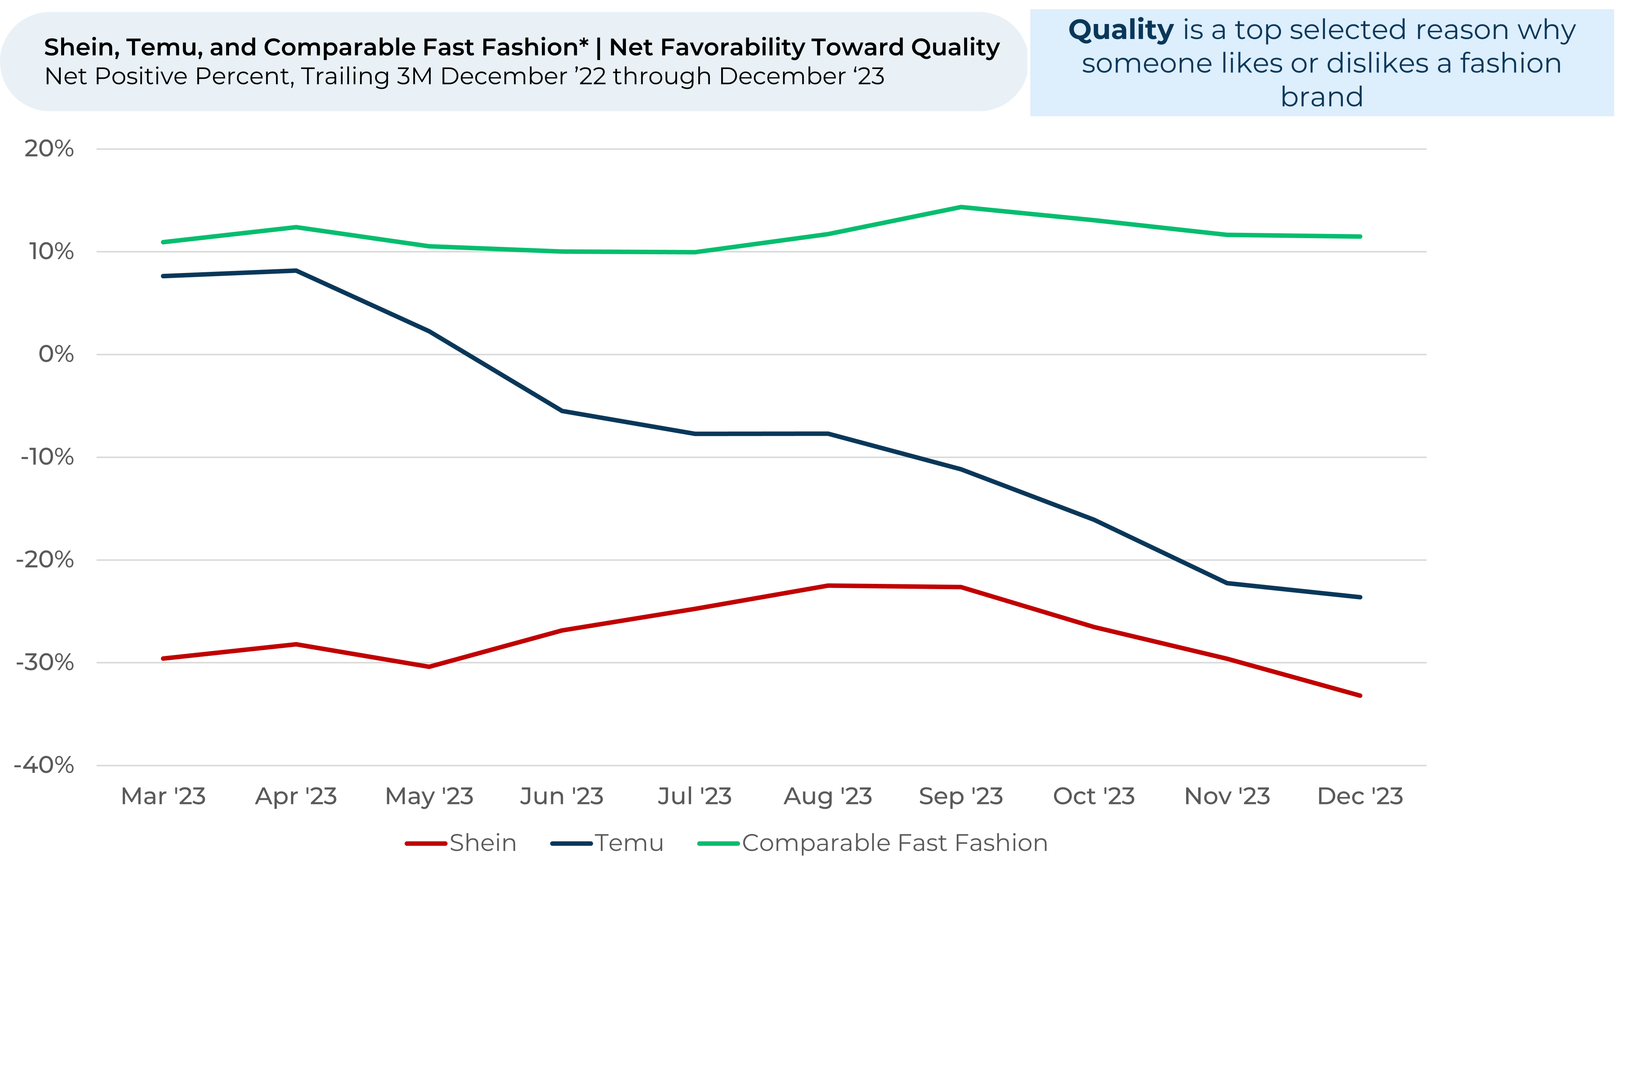
- Shoppers still love Shein’s and Temu’s prices, but increasingly dislike the quality of their products. Over the past six months, perception toward quality fell 6% for Shein and 18% for Temu while rising 1% for other fast fashion brands. At the same time, quality has risen in importance to customers, with 75% of HundredX respondents now listing quality as a reason they like or dislike Shein and Temu.
- One shopper summed up customer sentiment in a comment to HundredX in September, “You never know what you’re going to get with Shein. Sometimes it’s really good, other times it can be really bad. Their quality of products is inconsistent. Buying from them can be a gamble. At least their prices are fair.”
Please contact our team for a deeper look at HundredX's fashion, apparel, and footwear data, which includes more than 750,000 pieces of customer feedback across 230+ fashion-related brands.
- All metrics presented, including Net Purchase (Purchase Intent) and Net Positive Percent / Favorability, are presented on a trailing three-month basis unless otherwise noted.
- Purchase Intent represents the percentage of customers who expect to spend more with that chain over the next 12 months, minus those who intend to spend less. We find businesses that see Purchase Intent trends gain versus the industry or peers have often seen revenue growth rates, margins, and/or market share also improve versus peers.
- We’ve compiled an average of comparable fast fashion brands Forever 21, H&M, Mango, Poshmark, PrettyLittleThing, Uniqlo, and Zara.
- HundredX measures Net Favorability towards a driver of customer satisfaction as Net Positive Percent (NPP), which is the percentage of customers who view a factor as a positive (reason they liked the products, people, or experiences) minus the percentage who see the same factor as a negative.
Strategy Made Smarter
HundredX works with a variety of companies and their investors to answer some of the most important strategy questions in business:
- Where are customers "migrating"?
- What are they saying they will use more of in the next 12 months?
- What are the key drivers of their purchase decisions and financial outcomes?
Current clients see immediate benefits across multiple areas including strategy, finance, operations, pricing, investing, and marketing.
Our insights enable business leaders to define and identify specific drivers and decisions enabling them to grow their market share.
Please contact our team to learn more about which businesses across 75 industries are best positioned with customers and the decisions you can make to grow your brand’s market share.
####
HundredX is a mission-based data and insights provider. HundredX does not make investment recommendations. However, we believe in the wisdom of the crowd to inform the outlook for businesses and industries. For more info on specific drivers of customer satisfaction, other companies within 75+ other industries we cover, or if you'd like to learn more about using Data for Good, please reach out: https://hundredx.com/contact.

