Social Media Habits Vary by Household Incomes
Over the past few months, prominent social media companies slashed jobs and budgets to reduce costs amid a weakening ad market. Some companies, such as Twitter, have seen major changes. Elon Musk completed his purchase of Twitter in late October and immediately ousted company executives, including its CEO and CFO, and pushed the company to shift towards a subscription model.
Despite these challenges, many analysts agree that more than half of the world’s population of 8 billion people use some form of social media. We look to The Crowd, real consumers that use social media platforms and who share immediate feedback with HundredX, to discover which platforms have the best usage do the best job delighting their customers.
Analyzing more than 84,000 pieces of feedback on 23 social media and search brands, we find:
- While Facebook continues to lag peers, it saw the largest improvement in Usage Intent1 and Customer Satisfaction (CSAT) of the large brands we cover.
- The brands with the highest Customer Satisfaction (CSAT) tend to do better jobs than their peers pleasing customers with entertainment, ad volumes/strategy, and connecting them with other users.
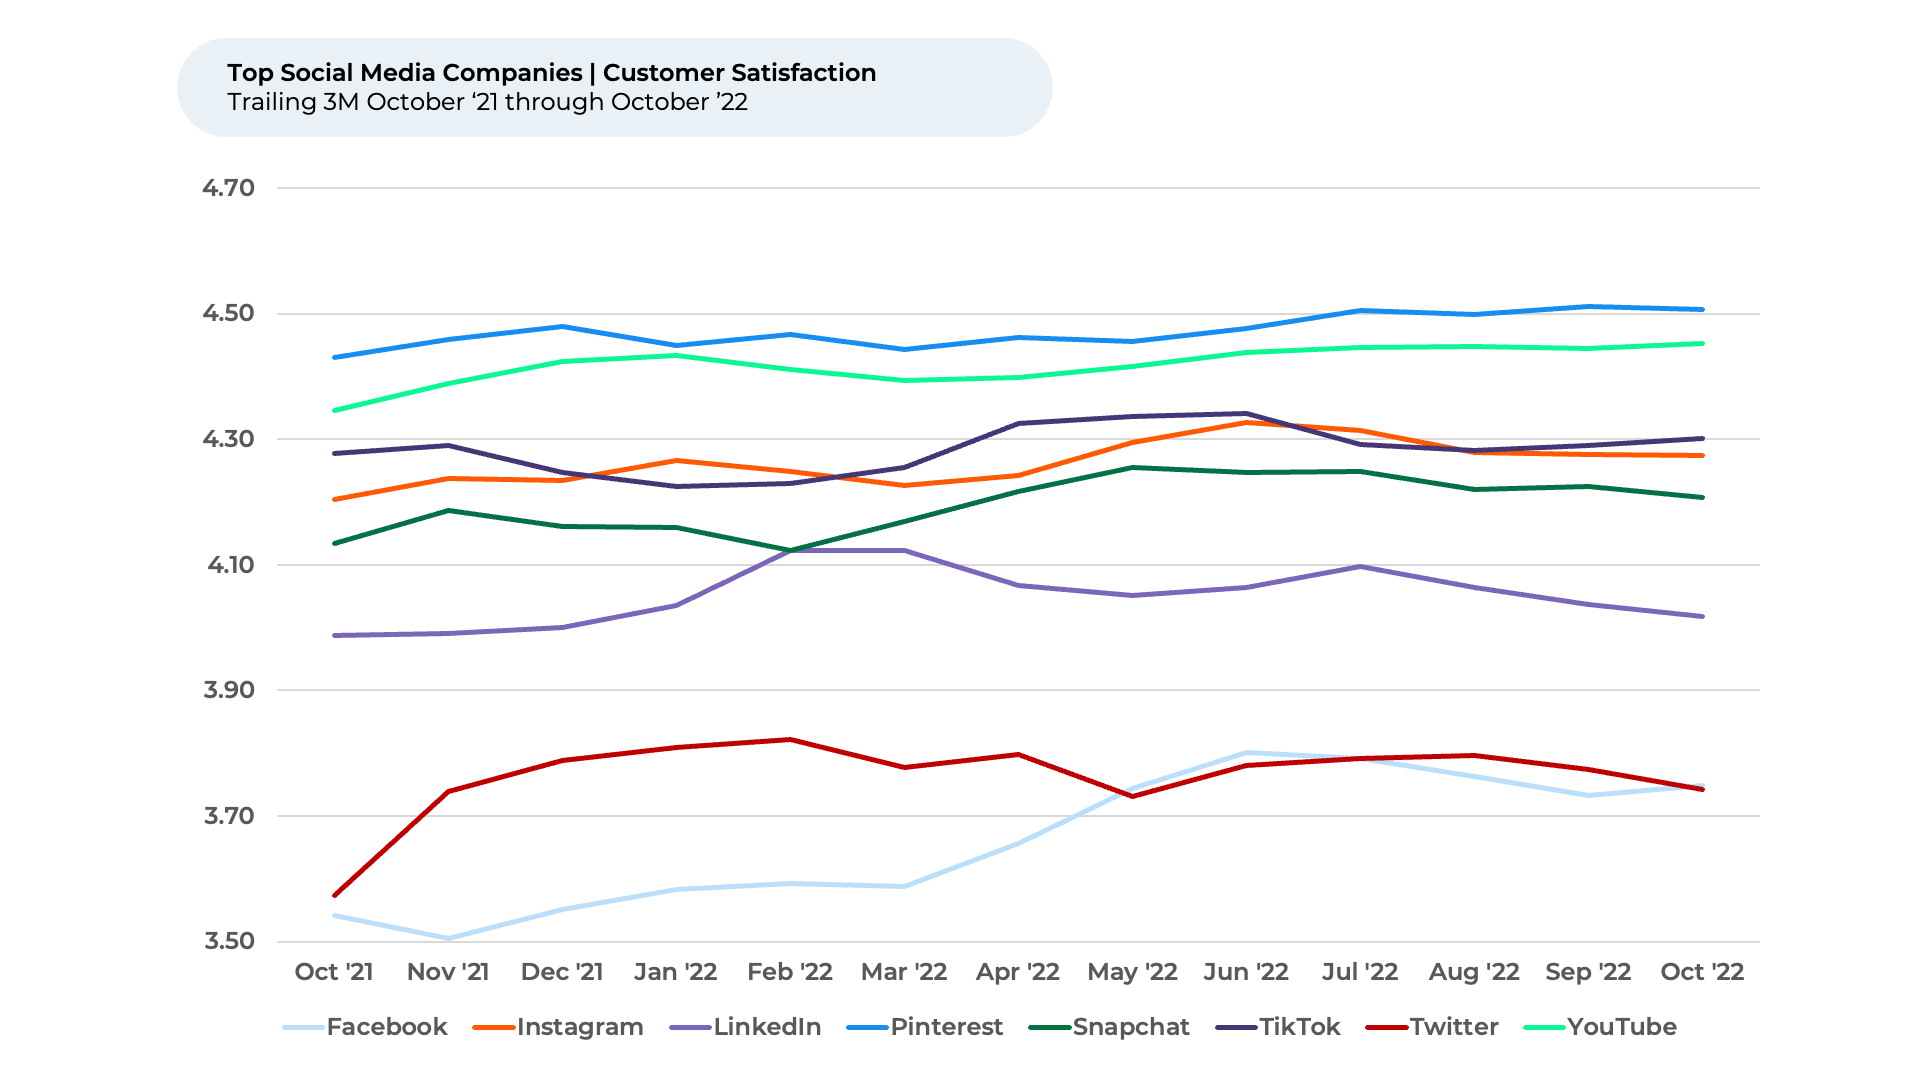
- Pinterest has the highest level of satisfaction among the major social media platforms.
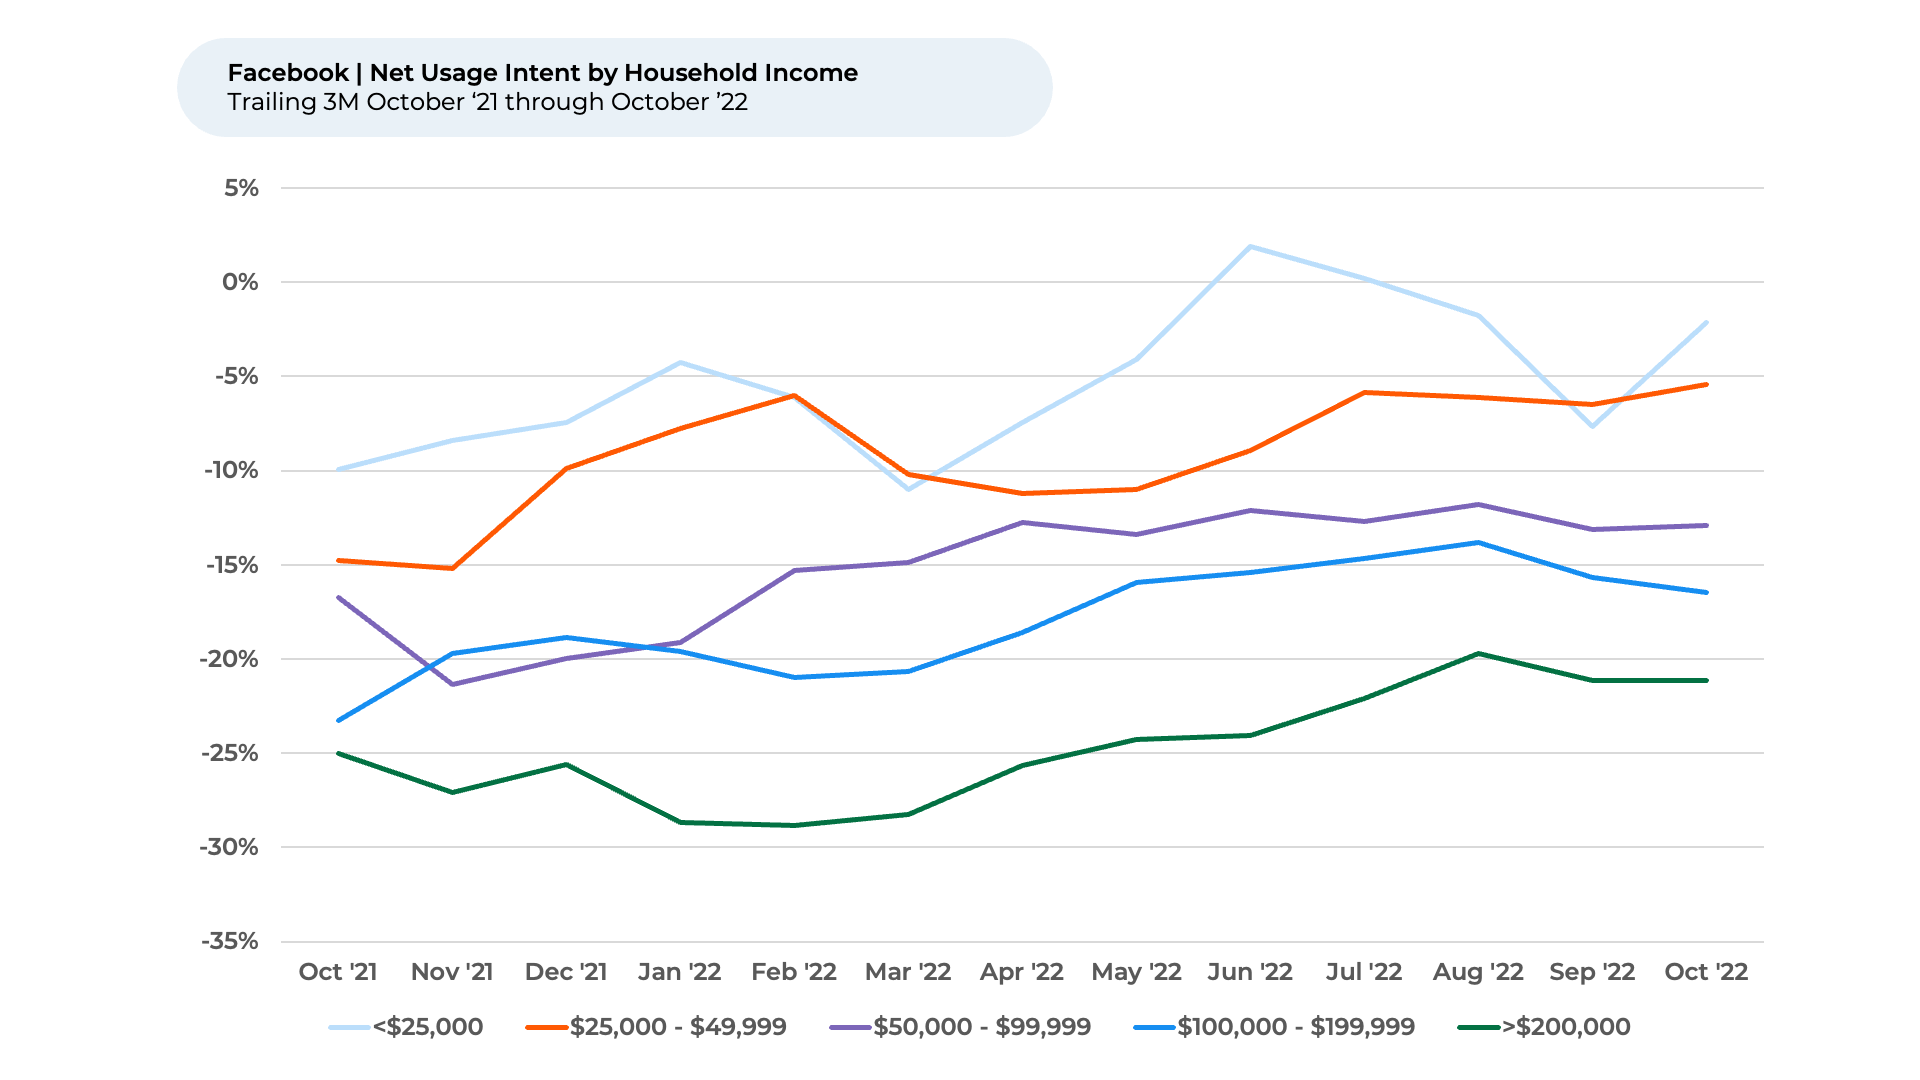
- Generally, consumers in households making less than $25k a year have the highest Usage Intent across social media platforms; Usage Intent falls as household income rises.
- While this general trend is also true for Facebook, Usage Intent for consumers in households making more than $200k a year actually increased the most this year.
Usage Intent Improving for Facebook
Of the largest brands we track, Facebook’s Usage Intent rose by the most (5%) this year through October 2022, while the industry was up slightly (1%) over the same period. Usage Intent for social media and search platforms reflects the percentage of customers who expect to use the service more over the next 12 months minus those that intend to use it less. We find businesses that see Usage Intent trends lag the industry have often seen growth in domestic users and engagement also lag peers.
While Facebook navigated several controversies this year, it also continued to invest in its customer experience with initiatives including improving automated hate speech detection, simplifying searches for groups, and introducing new tools for creators to build businesses. Some users have taken notice, with one telling HundredX this month that Facebook is “Constantly updating features.” Another shared, “Facebook has been controversial for a while, but then they opened up a creator fund so people can make money from posting their reels… it’s nice to earn extra cash while doing something I love."
Facebook’s Usage Intent trends by income level mirror overall social media, but the fact that its greatest Usage Intent improvement this year came from the highest earning households contrasts with the broader industry. Both Facebook and social media platforms overall see Usage Intent highest among people in households making less than $25,000 per year. Usage intent for Facebook and the industry both fall as the income level rises, with individuals in households making $200K or more having the lowest Usage Intent. However, the biggest earners saw the largest increase in Usage Intent this year (+8%), while the two lowest ones saw the lowest increase (+2%).
Pinterest leads in customer satisfaction
Facebook’s Customer Satisfaction also rose the most of the large social media brands, moving from 3.5 (5-point scale) at the end of last year to 3.7 as of October 2022, while the broader group average was roughly flat. Nevertheless, it continues to lag most of its major peers.
TikTok leads in satisfaction with entertainment
Pinterest leads the social media companies in terms of keeping The Crowd happy, followed closely by YouTube. On a five-point scale, Pinterest ranks 4.5 in terms of CSAT as of October 2022. Pinterest leads peers in sentiment1 towards most top drivers of satisfaction by 10%-30%, including Ads, Navigation, how Informational quality, Site Layout, and Variety. “I look up recipes several times per week. I also browse Pinterest any time I need ideas for pretty much any task. I have used Pinterest for hair tutorials, home decor ideas, crafts, and many other projects. Pinterest has content for every imaginable topic on the planet. I love it,” one happy user told HundredX.
HundredX measures sentiment as the percentage of customers who view a factor as a reason they like the brand minus the percentage who see it as a reason they don’t like the brand. Interestingly, Entertaining, the top driver for the industry based on selection frequency, is one of the few where Pinterest remains in-line with average peer group sentiment.
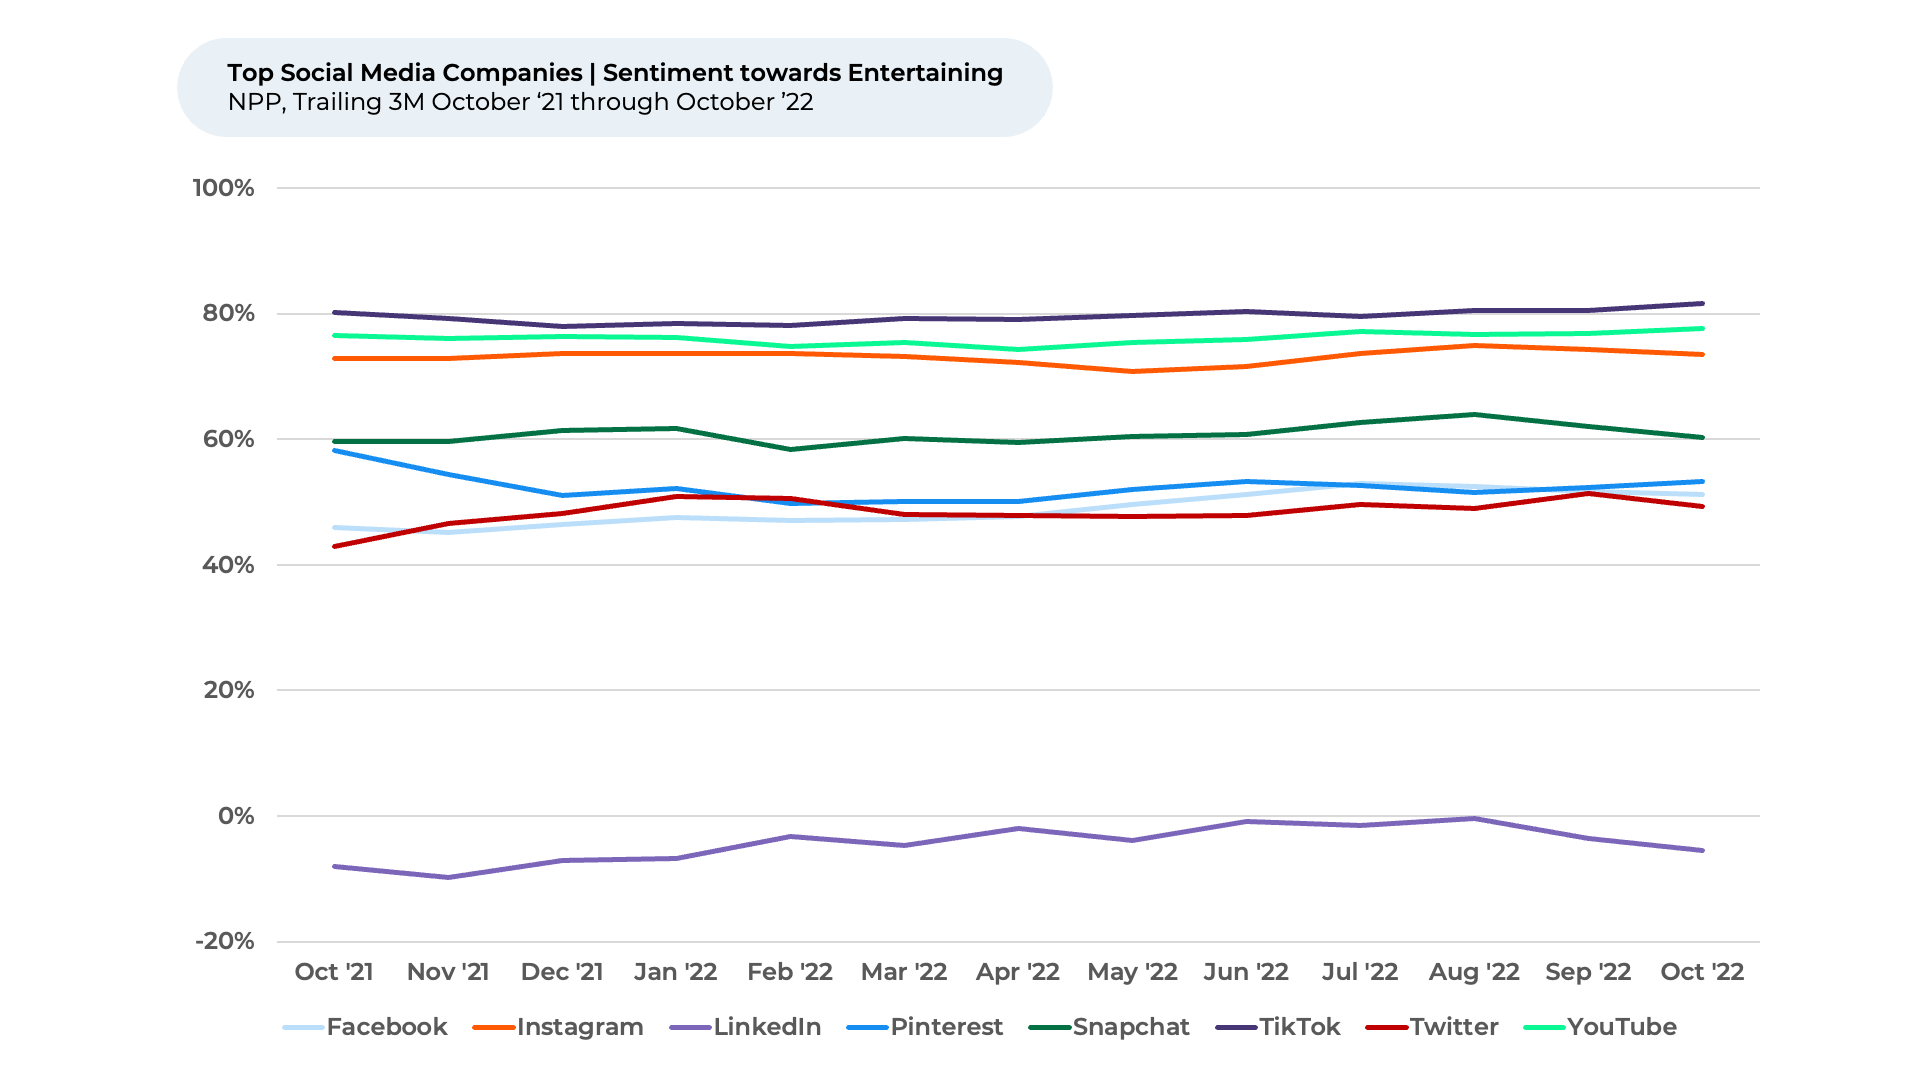
TikTok leads the pack for the Entertaining driver, with a sentiment of 81%, well ahead of the 53% group average for October 2022. YouTube follows closely at 77%, with Instagram next at 74%. TikTok seemingly understands its role as a form of entertainment. Blake Chandlee, TikTok’s president of global business solutions, referred to TikTok as an “entertainment platform,” not a social media platform, during an interview with CNBC earlier this year.
One TikTok fan said to HundredX, “TikTok provides great entertainment and I sometimes learn new things through the app! TikTok is a great way to connect me to new influencers and new causes!”
Satisfaction with Ads fell for most platforms starting in Summer 2022
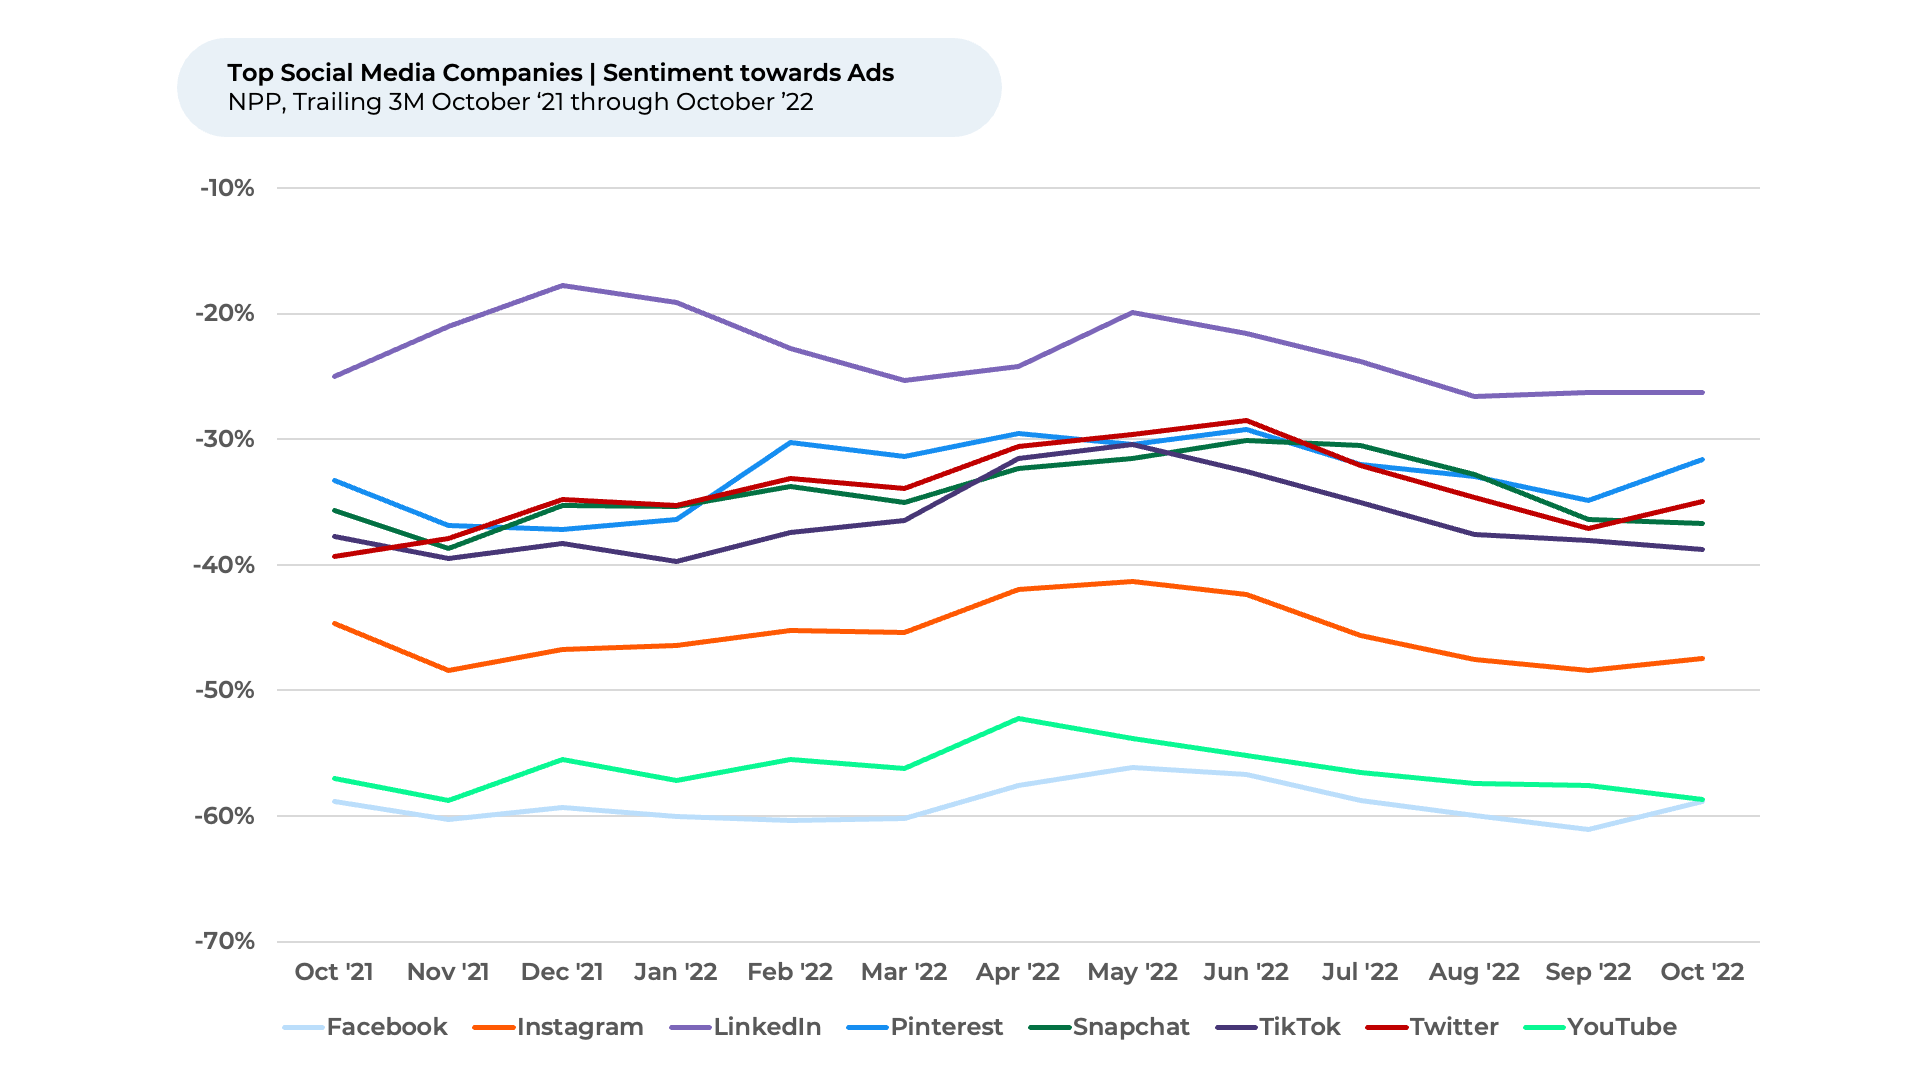
Overall, social media companies saw little fluctuation in customer sentiment towards Entertaining over the past year. By contrast, we find sentiment towards Ads began declining in June 2022 across all major social media platforms. We believe this is likely connected to an increase in political ads ahead of the midterm election in November 2022. According to ad tracking company AdImpact, political digital ad spending saw a notable increase on Facebook and Google starting June 2022. We will look to see if sentiment begins to recover since elections are now complete.
A place to connect users
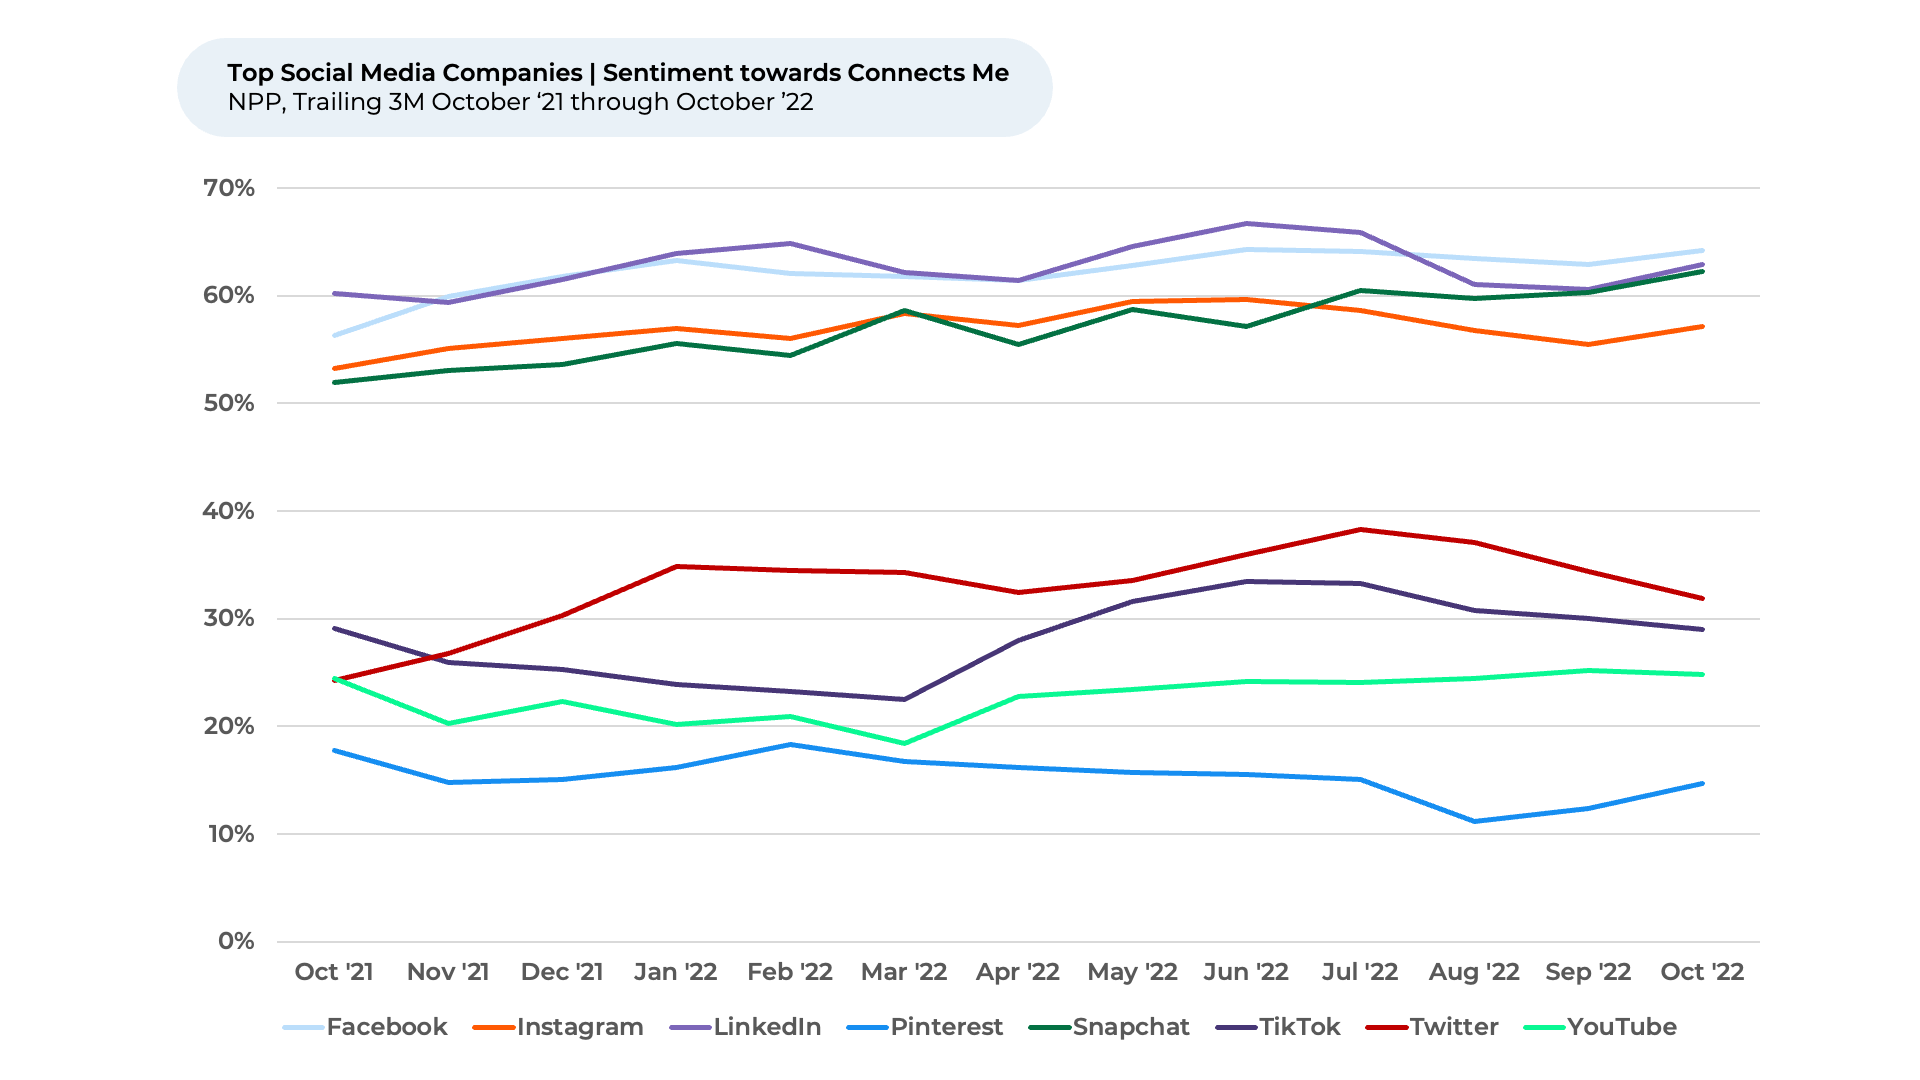
While most social media platforms trended downward in sentiment towards Connects Me since July 2022, Snapchat moved upward slightly. Snapchat launched a web-based version of its messaging app in July. In August, the company introduced its first parental controls, allowing parents to see their children’s contacts.
“I really enjoy Snapchat to connect with friends. (It’s) a very different experience than other popular social apps,” one Snapchat user told HundredX. Another said, “Snapchat is my only form of communication with some of my friends.”
While Twitter users’ sentiment towards Connects Me has fallen from its high in July 2022, it still saw one of the biggest improvements since a year ago. Twitter released a few new features in the months leading up to October 2021, including a feature enabling users to better curate their follower list.
“Twitter is fantastic for connecting me with other scientists and allowing me to experience community. Especially now when we're all remote,” one person told HundredX.
We will continue to monitor how social media platforms perform with their users as they make significant staffing cuts and plan for new features in the coming year. With Elon Musk now at its helm, Twitter seems poised to make significant changes the next few months . We will also keep a close eye on Facebook to see if it continues its upward trend in Usage Intent and customer satisfaction.
To learn more about the drivers behind social media companies’ CSAT score please contact us.
(1) All metrics presented, including Net Purchase Intent / Purchase Intent, Net Usage Intent (Usage Intent) and
Net Positive Percent / Sentiment are presented on a trailing three month’s basis unless otherwise noted.
Strategy Made Smarter
HundredX works with a variety of companies and their investors to answer some of the most important strategy questions in business:
- Where are customers "migrating"?
- What are they saying they will use more of in the next 12 months?
- What are the key drivers of their purchase decisions and financial outcomes?
Current clients see immediate benefits across multiple areas including strategy, finance, operations, pricing, investing, and marketing.
Our insights enable business leaders to define and identify specific drivers and decisions enabling them to grow their market share.
Please contact our team to learn more about which businesses across 75 industries are best positioned with customers and the decisions you can make to grow your brand’s market share.
####
HundredX is a mission-based data and insights provider and does not make investment recommendations. We believe in the wisdom of "the Crowd" to inform the outlook for businesses and industries. For more information about the drivers we monitor behind social media and any of our 75+ other industries, or if you'd like to learn more about using Data for Good, please reach out: https://hundredx.com/contact
Share This Article