Whether you’ve posted on TikTok, responded to work emails, played a game, or just checked the weather, you’ve probably used your phone today. Probably more than once, and probably more than you’ve wanted.
We all know people love, or love-hate, their smartphones, but how do they feel about their wireless carriers? The answers vary, A LOT, by the type of carrier and the income of the customer. By combing through 70,000 pieces of feedback on 19 wireless carriers from February 2022 through February 2023, HundredX finds:
- Loyalty Intent¹,² is highest for the big-three carriers (Verizon, AT&T, and T-Mobile in order), but has increased the most in recent months for top budget carriers.
- Data from “The Crowd” of real customers indicates investments by budget carriers could help them gain share with higher income customers who are feeling the pinch from high inflation.
- Loyalty Intent for the big-three carriers is highest among the highest income earners. For the budget carriers, it’s highest for middle-income customers.
- Loyalty Intent for customers making $100K-$199K per year has fallen for the big-three carriers over the last three months while rising for budget carriers.
- Customers have felt increasingly happy³ about the pricing of budget carriers, which has caught up to price sentiment for the big-three. However, customers still strongly prefer the big-three coverage areas.
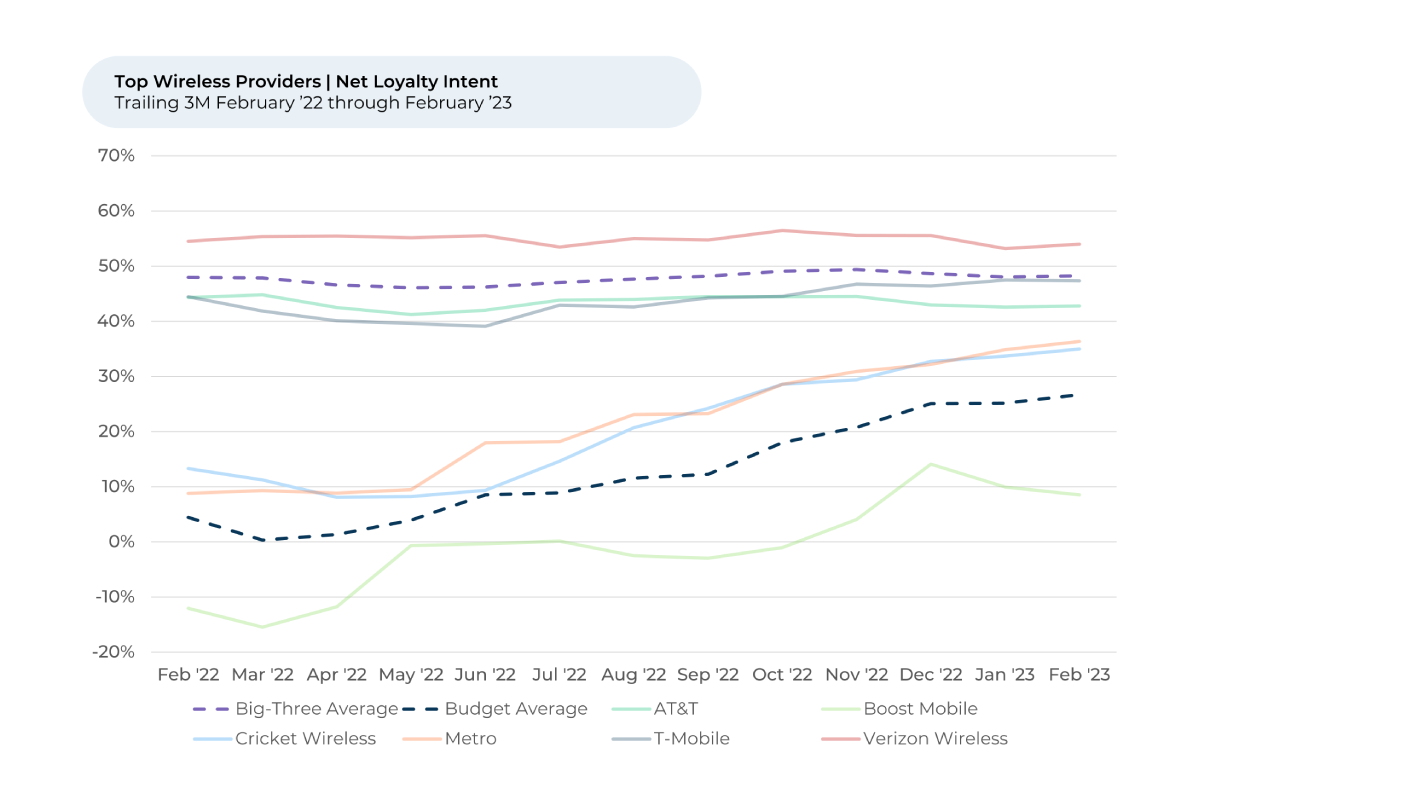
Wireless customers are most loyal to the big-three carriers -- Verizon, T-Mobile, and AT&T, in that order. An average of 50% of these three companies’ customers intend to keep their service over the next year.
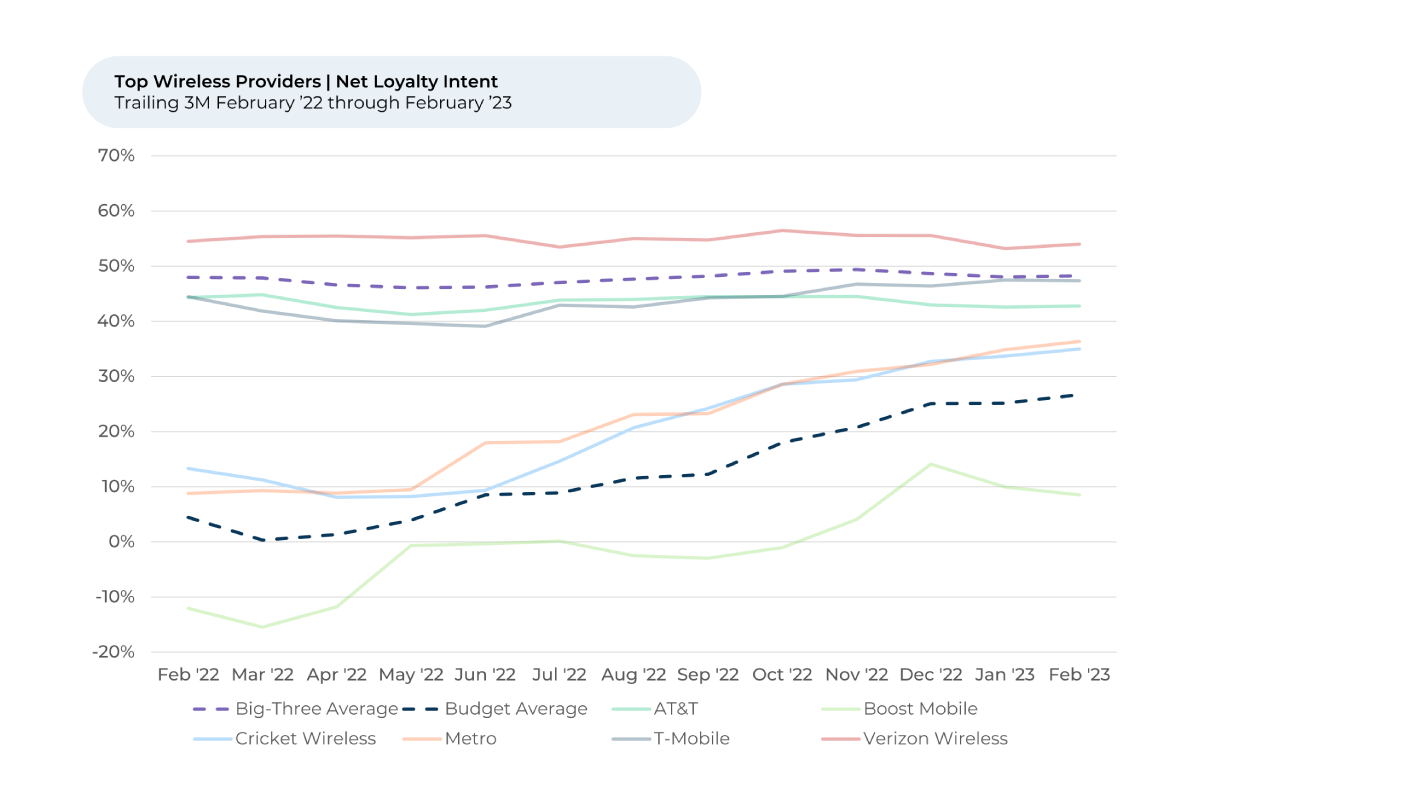
The Loyalty Intent average for top-budget wireless providers is far lower – 27% as of February 2023. These providers (Boost Mobile, Cricket Wireless, and Metro) offer wireless services for a fraction of the cost of the big-three companies, but at times have slower speeds or less coverage.
Despite being lower, Loyalty Intent for the budget carriers has significantly narrowed the gap with the big-three. They are up 6% over the last three months and 22% over the past year while the big-three carriers have been relatively flat the whole time. If you are feeling bad for top carriers, you should know that many of the biggest budget providers are owned by the big-three providers: T-Mobile owns Metro, AT&T owns Cricket, Verizon own Visible.
Higher Income Households are Starting to Shift Towards Cheaper Carriers
Household income seems to play a role in the wireless carriers’ Loyalty Intent. For the big-three carriers, Loyalty Intent is highest among customers in households making more than $200K per year. Loyalty Intent among customers making $100K - $199K per year follows close behind. This makes sense – the highest earners seemingly don’t feel as much of a need to switch to a cheaper, and perhaps less stable, service.
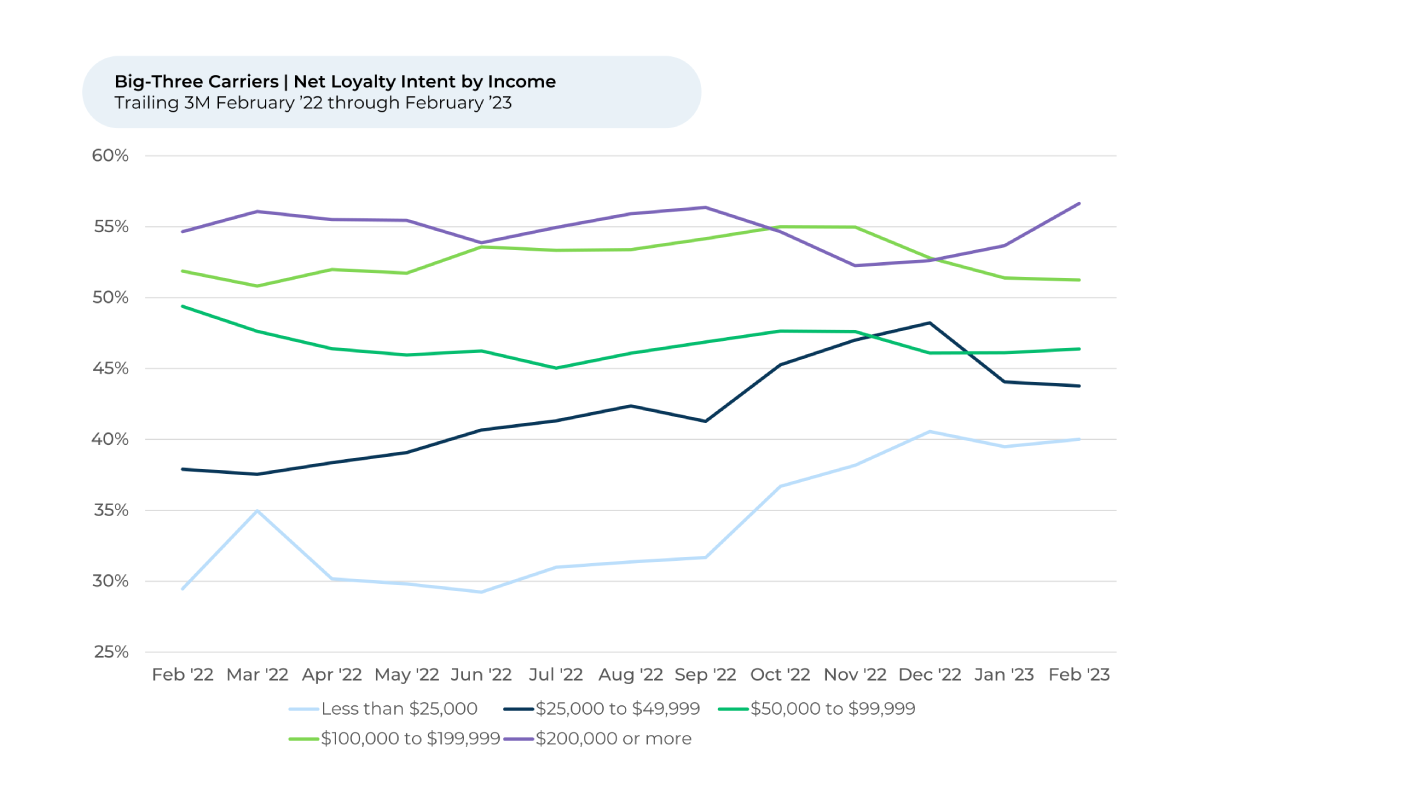
But something interesting has been happening over the past three months. While Loyalty Intent increased 4% for customers making more than $200K per year since November, it decreased the same amount for customers making $100K - $199K per year. The decrease erased any gains the overall group would have seen over the past year.
That dip interestingly corresponds to an increase in Loyalty Intent for budget providers with customers making $100K - $199K per year.
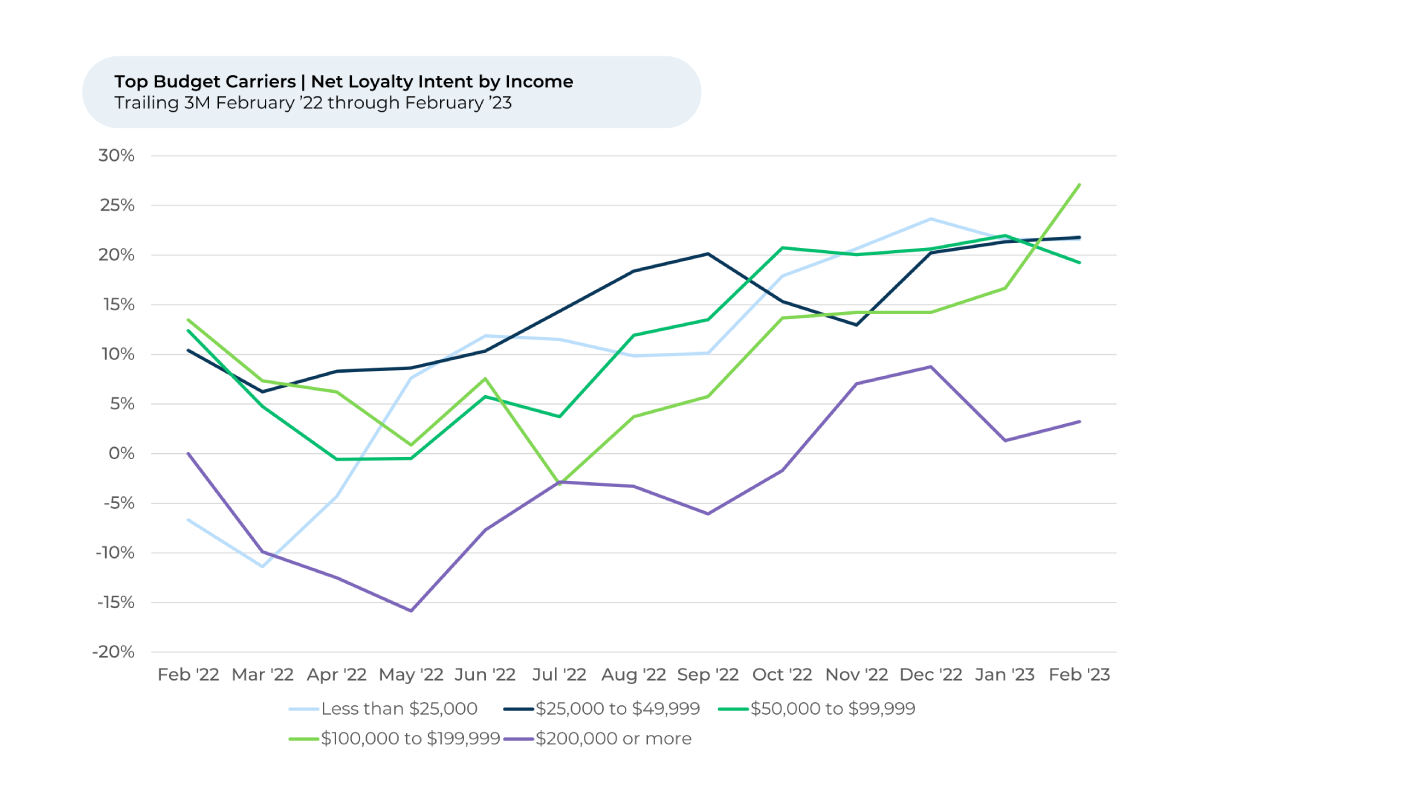
Loyalty Intent for that income bracket increased 13% for budget providers over the past three months. At the same time, it dropped 4% for customers making more than $200K per year.
The data seems to suggest that high-middle-income households are switching, or planning to switch, from a big-three provider to a cheaper alternative. Analysis by economist Shernette McLeod shows that recent inflation was felt more by middle-income and higher-income households in the U.S. compared to lower-income households. Research from LendingClub shows that in 2022 more people earning over $100K per year are living paycheck to paycheck than in 2021.
“It's a great product, great store but prices are way too expensive. Can't afford it with this inflation going on,” one customer recently said of a big-three carrier.
Views on Price and Coverage Area
“The Crowd” of real phone customers sharing feedback with HundredX has been feeling happier about the pricing of budget carriers over the last year. Customers’ sentiment towards the price of budget carriers surged almost 15% from a bottom in April 2022. In the last three months, sentiment towards pricing for the budget-carriers has caught up to sentiment for the big-three.
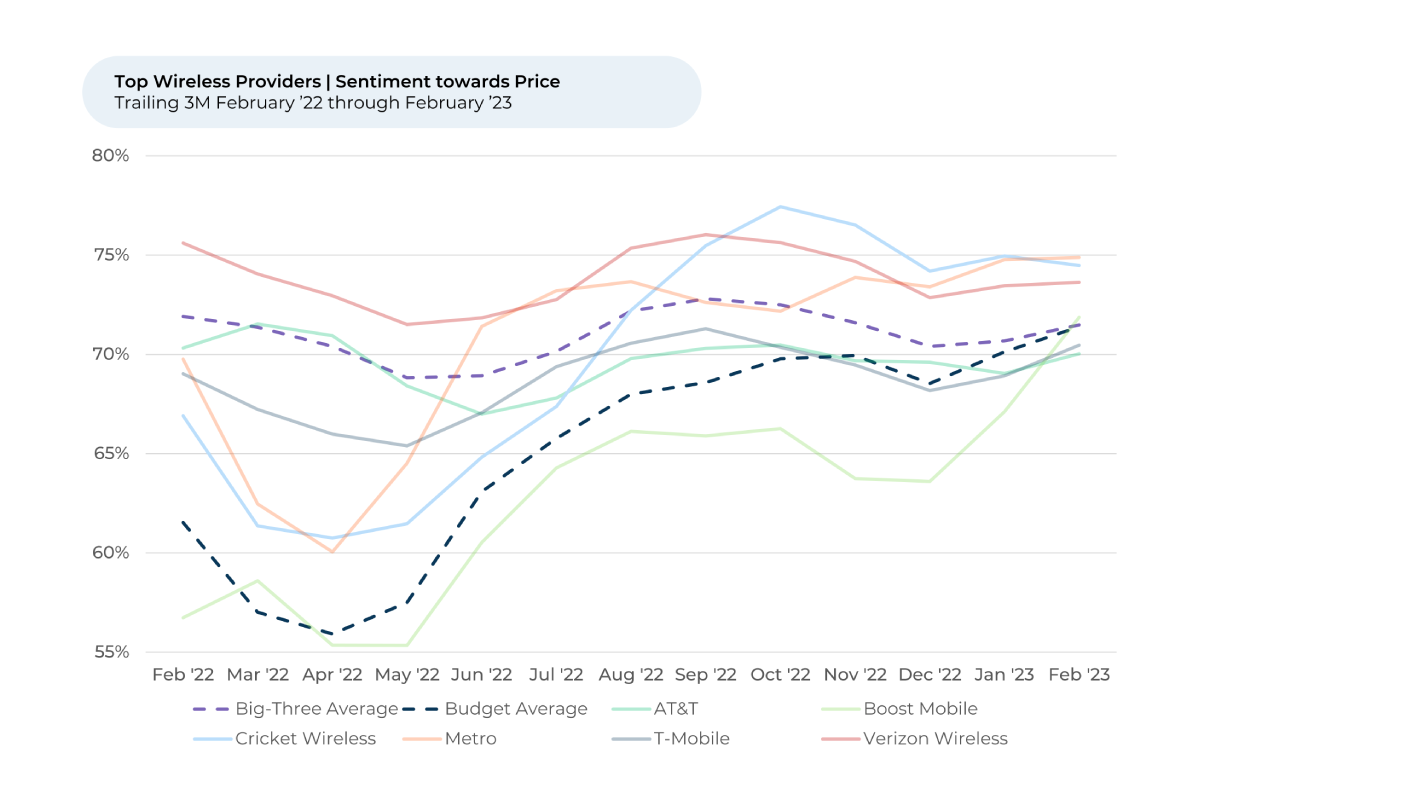
Much of the recent increase is powered by Boost Mobile, the budget carrier owned by Dish Wireless, the fourth largest wireless provider in the U.S. Price sentiment towards Boost, Cricket, and Metro are all up 14%-17% since their bottom in April 2022, but Boost is up the most overall (17%) and in the last three months (8%).
“Boost Mobile is a low-cost, high-value mobile phone company which has allowed us to provide phones for our family without breaking the bank,” one Boost customer recently told HundredX.
While sentiment towards price is highest for Metro, Cricket, and then Verizon, Boost is catching up fast. In December 2022, Boost launched Boost Infinite in beta. The plan offers unlimited calling, texting, and data for just $25 a month, far less than plans offered by the big-three providers.
While the price is right for budget carriers, customers are less pleased with their coverage areas. Price and coverage area are the most important reasons a customer likes or dislikes a wireless provider.
Coverage area sentiment is highest, by far, for Verizon at 50%, followed by AT&T at 32%. The average sentiment towards coverage area for budget carriers, however, has hovered around 12% over the past three months.
Verizon continues to be the leader in sentiment towards coverage area, reflecting credit for its investment in both its infrastructure and marketing of its coverage area. Verizon, which prides itself on its coverage, covers nearly all of the U.S. with its 4G LTE service. It offers 5G service is dozens of cities across the U.S.
“Love the 5G coverage and unlimited service plans,” one Verizon customer recently told HundredX.
Another customer said the service is “reliable.” “(I) can get service in elevators, lower levels in buildings, lower parking decks, in remote areas when others cannot get phone access from their carrier at all.”
HundredX will continue monitoring how customers view their wireless carriers as the economy shifts in 2023. How will middle-to-high-income earners react to continued inflation or other economic problems? Time, and HundredX, will tell.
- All metrics presented, including Net Loyalty Intent (Loyalty Intent), and Net Positive Percent / Sentiment are presented on a trailing three-month basis unless otherwise noted.
- Loyalty Intent represents the percentage of customers who expect to stay with their carrier over the next 12 months, minus those that intend to switch carriers.
- HundredX measures sentiment towards a driver of customer satisfaction as Net Positive Percent (NPP), which is the percentage of customers who view a factor as a positive (reason they liked the products, people, or experiences) minus the percentage who see the same factor as a negative.
Strategy Made Smarter
HundredX works with a variety of companies and their investors to answer some of the most important strategy questions in business:
- Where are customers "migrating"?
- What are they saying they will use more of in the next 12 months?
- What are the key drivers of their purchase decisions and financial outcomes?
Current clients see immediate benefits across multiple areas including strategy, finance, operations, pricing, investing, and marketing.
Our insights enable business leaders to define and identify specific drivers and decisions enabling them to grow their market share.
Please contact our team to learn more about which businesses across 75 industries are best positioned with customers and the decisions you can make to grow your brand’s market share.
####
HundredX is a mission-based data and insights provider. HundredX does not make investment recommendations. However, we believe in the wisdom of the crowd to inform the outlook for businesses and industries. For more info on specific drivers of customer satisfaction, other companies within 75+ other industries we cover, or if you'd like to learn more about using Data for Good, please reach out: https://hundredx.com/contact.


