Sitting at home, enjoying a show on your TV or computer? Us too. While doing so, our team at HundredX also took the time to analyze the video streaming space to bring you the latest customer trends for the hottest streaming services.
As we found in our recent analysis of music streaming, most home entertainment industries have stayed within a range over the past year. Usage Intent has stayed flat for video streaming over the past few months, even as it had modest increases for music streaming, sports entertainment, news media, and social media and search. It fell for video games.
That’s not the whole story for video streaming, however. Recently, Usage Intent increased modestly for a few of the leading streaming services, including Netflix and Amazon Prime. The reason appears to lie with the oldest and the youngest viewers.
After analyzing 100,000 pieces of feedback on 17 video streaming services, we find:
- Over the past three months, Usage Intent¹ fell for most streaming services but rose the most for Amazon Prime, followed by Netflix.
- Amazon appears to be getting credit for recent investments in user experience and content. There may be room to gain more share with additional investment in original content.
- Video streaming Usage Intent recently increased the most, and is now the highest, for older customers. Netflix saw its Usage Intent spike in recent months for viewers between 50 – 59.
- Over the past three months, customers have felt² worse about the price of most leading streaming services. However, customer sentiment was stable about Netflix’s prices, perhaps indicating they have adjusted to last year’s price hikes and the newer ad-supported tier.
While Usage Intent remained flat for the streaming industry over the past three months, several major streaming services saw slight upticks. Amazon Prime rose the most. Over the past three months, Amazon Prime streamers have felt more positive about the service’s amount of programming, variety, and ease of use.
It appears Amazon is getting credit for substantial updates to the Amazon Prime user interface in July of 2022 along with its programming breadth. The interface refresh made it easier for users to browse and search for content. As of September 2022, outlets reported that Amazon Prime, at over 20,000 titles, had the largest collection of movies and TV compared to any other streaming competitor. It appears recent investments in original content are appreciated as well, with potential to gain even more market share if it invests more in original content.
One happy streamer recently told HundredX, “Like the Amazon originals but wish they came more frequently. Several of my favorites on this streaming service.” Another shared, “I love Amazon Prime Video! Was trying not to pay for a video streaming service but got it to get free shipping and it is great!”. A third shared, “Easily has the most workable user interface of all the streaming apps I use. Always coming out with tons of original content.”
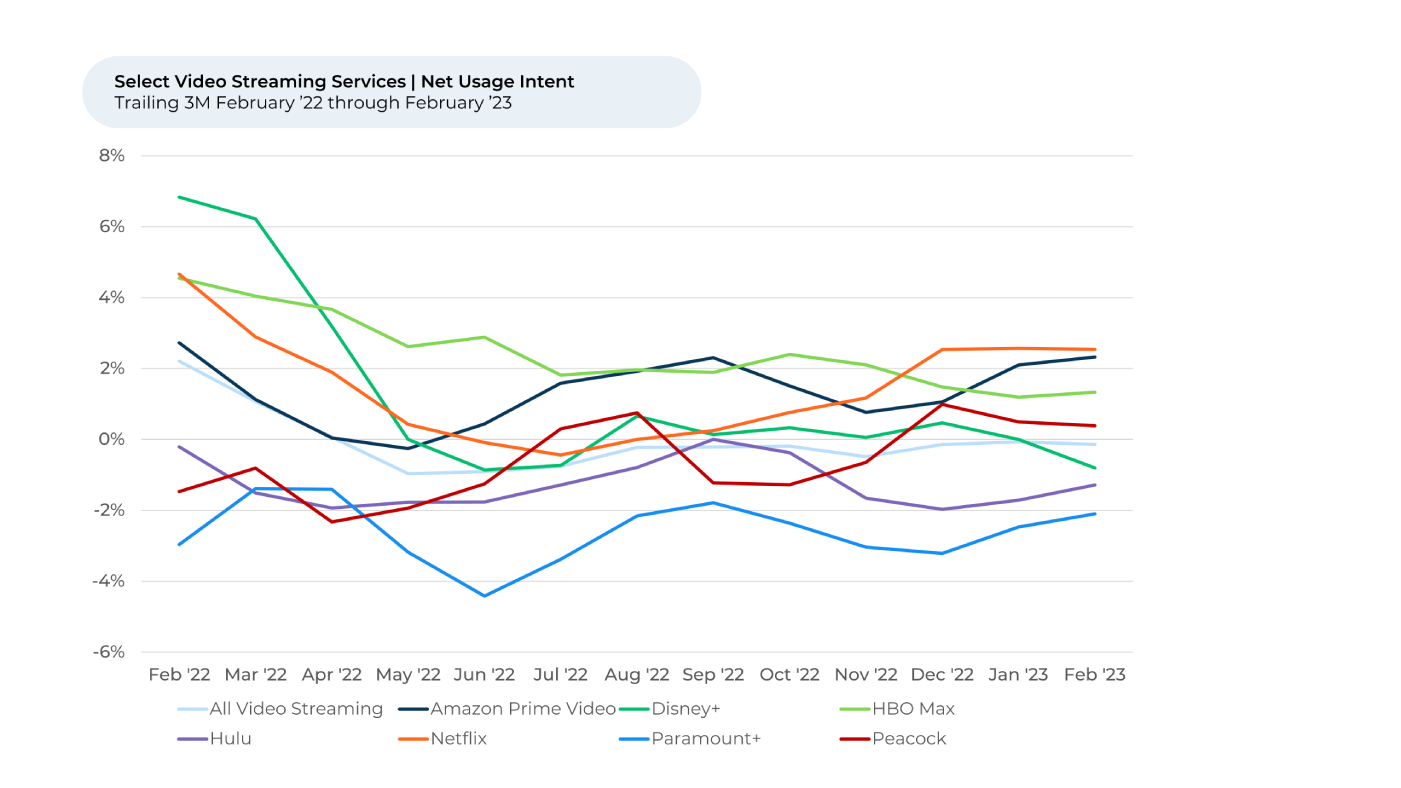
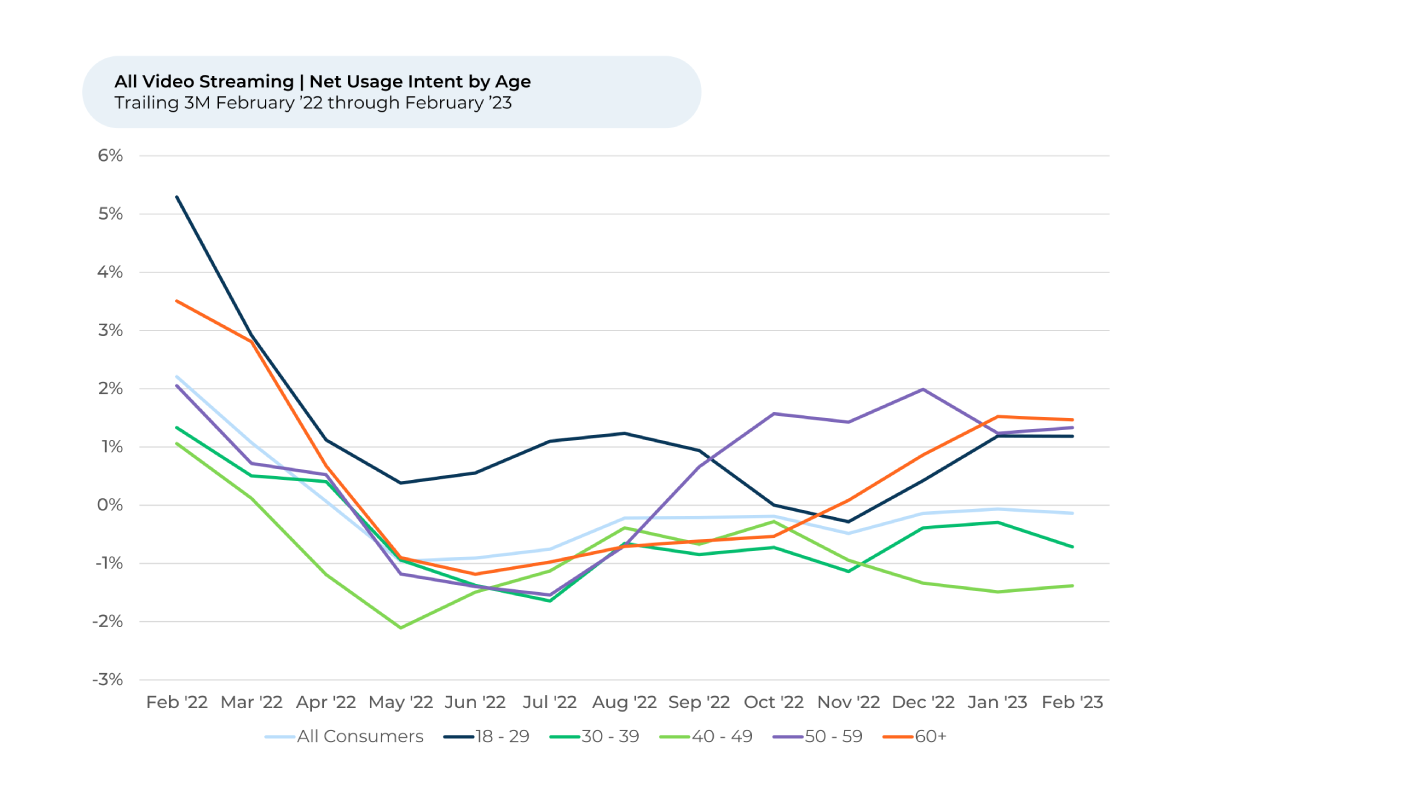
Across all streaming services, Usage Intent increases appear powered by both the youngest and the oldest customers. While Usage Intent for the video streaming industry was relatively flat for most viewers over the past three months, there was a modest pickup for viewers 18 – 29 and over 60 (both up 1% since November). The recent gains make the 60+ group the highest in Usage Intent, followed by the 50 – 59 and then 18 -29 groups.
Netflix gaining with “middle age” and lower income households?
Netflix, which saw its Usage Intent increase over the past six months, particularly benefited from what most people consider “middle age” viewers. Netflix’s Usage Intent skyrocketed (+5%) over the past three months in particular for customers 50 – 59, followed by 40-49 (+4%) and up about 1% for the rest. Usage Intent during that time also rose significantly for Netflix watchers in households making less than $25,000 per year (+9%) and making between $25,000 - $49,999 per year (+5%). It dropped or stayed within a range for higher income groups.
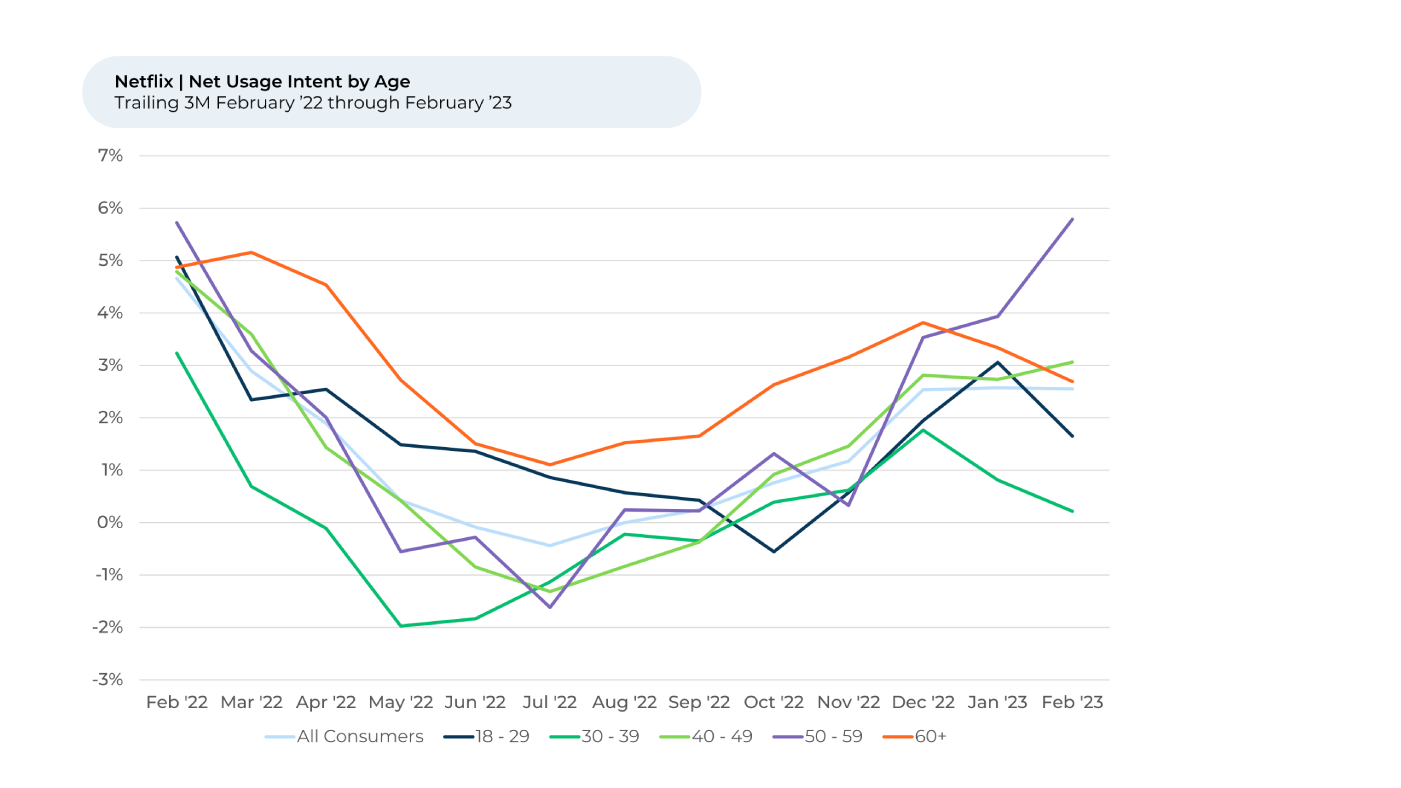
The Usage Intent surge for customers 50 – 59 appears driven in part by Netflix’s original content, recommendations and subscription options. Over the past three months, customers within that age group felt notably happier about these factors, along with prices.
One 50-59 Netflix customer recently told HundredX, “I enjoy some of the Netflix originals. I enjoy being able to find something new and different to watch when there is nothing else on TV.” Another shared, “Netflix offers parental controls which I appreciate greatly. There are always new releases and I appreciate the previews. I also enjoy watching seasons! There is always something to watch on Netflix. They offer a lot! And the price is great!
Netflix launched its long-awaited ad-supported in October, which, at $6.99 per month, costs 30% less than its cheapest ad-free plan. The release could help explain why 50-59-year-olds feel more positively about Netflix’s subscriptions options, and why Usage Intent increased recently for people in lower-income households.
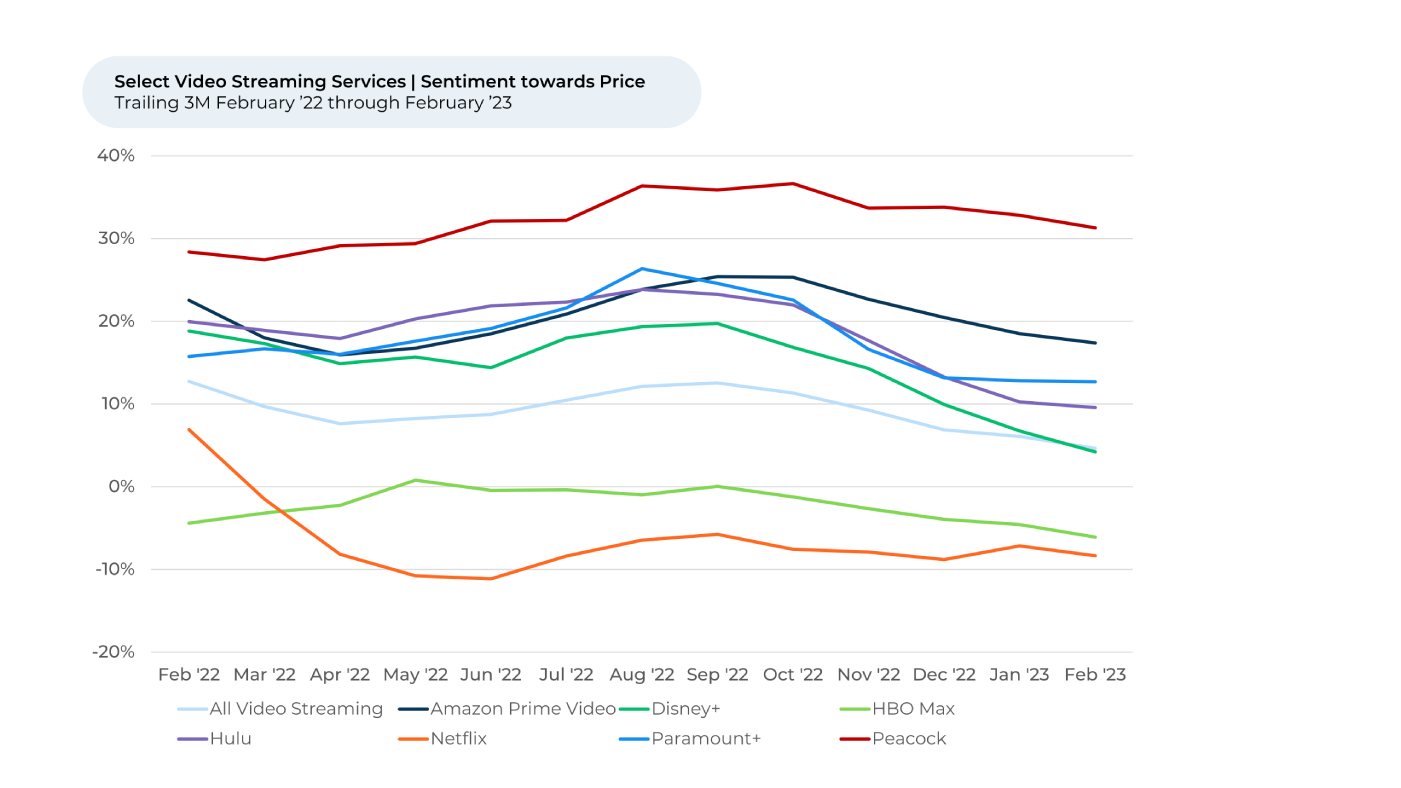
Netflix customers felt significantly worse about the streaming service’s price after Netflix announced a price increase in January 2022. However, those feelings quickly stabilized after the increase went into effect at the end of March 2022, and have remained relatively stable since then.
The spread in sentiment between other services and Netflix has narrowed the past three months, as other services have adjusted their pricing. Customers’ sentiment towards price for all the other video streaming services we cover fell by 6% vs. flat for Netflix. We note Netflix customers’ sentiment towards price is still the lowest compared to peers.
The new ad-supported subscription option is likely the reason: Usage Intent is still moderately higher for Netflix customers who subscribe to the ad-supported plan compared to customers who subscribe to the ad-free plans.
A year after facing backlash for a steep price increase, Netflix appears to be recovering its standing with its viewers. HundredX will continue watching how Netflix performs vs. the industry as it prepares to roll out anti-account sharing measures in the U.S. and its competitors continue to adjust. Keep an eye out over the coming months for new analyses on the video streaming industry.
- Usage intent reflects the percentage of customers who plan to use a specific brand during the next 12 months minus the percentage who plan to use less. All metrics presented, including Net Usage Intent (Usage Intent), and Net Positive Percent / Sentiment are presented on a trailing three-month basis unless otherwise noted.
- HundredX measures sentiment towards a driver of customer satisfaction as the percentage of customers who view a factor as a positive (reason they liked the products, people, or experiences) minus the percentage who see the same factor as a negative.
Strategy Made Smarter
HundredX works with a variety of companies and their investors to answer some of the most important strategy questions in business:
- Where are customers "migrating"?
- What are they saying they will use more of in the next 12 months?
- What are the key drivers of their purchase decisions and financial outcomes?
Current clients see immediate benefits across multiple areas including strategy, finance, operations, pricing, investing, and marketing.
Our insights enable business leaders to define and identify specific drivers and decisions enabling them to grow their market share.
Please contact our team to learn more about which businesses across 75 industries are best positioned with customers and the decisions you can make to grow your brand’s market share.
####
HundredX is a mission-based data and insights provider. HundredX does not make investment recommendations. However, we believe in the wisdom of the crowd to inform the outlook for businesses and industries. For more info on specific drivers of customer satisfaction, other companies within 75+ other industries we cover, or if you'd like to learn more about using Data for Good, please reach out: https://hundredx.com/contact.


