Shakeup Likely for Streaming Services
While consumers are still tuning in for bingeworthy content, recent data from HundredX signals a potential further shakeup in relative subscriber growth rates among the leading streaming service providers. As HundredX continues to monitor this space, we see some compelling trends evolving based on what consumers told us in 2Q 2022 about their future usage intent for streaming services versus 1Q 2022.
1Q 2022 Recap
In March, HundredX
shared 'crowd wisdom' on the major streaming providers – that is, real feedback provided to us from thousands of actual streaming customers. At that time, "the crowd" signaled Netflix’s subscriber growth slowing based on QOQ declines in net future usage intent, measured as the percentage of customers who said they intend to use the streaming service more over the next 12 months minus those who intend to use it less. In
previously shared data
by HundredX, the "crowd" signaled a slowdown well before the streaming giant reported subscriber figures that shocked investors. Further, the “crowd” we heard from, comprised of 18K streaming customers, got the order of relative subscriber growth right for 6 out of the 7 streaming companies we analyzed in 1Q 2022, with Paramount+ the strongest and Netflix the weakest.
2Q 2022 Update
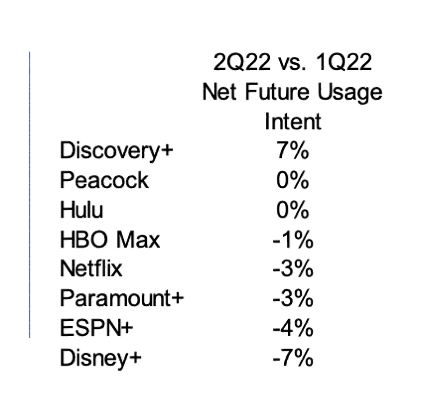
During 2Q22 almost 19K customers shared unprompted feedback with HundredX on streaming companies. We note, this quarter saw a shift in the relative order of QOQ change in future usage intent for 2Q 2022 versus 1Q 2022. The change may indicate Netflix will be left hanging the next time it asks whether viewers are still watching.
Discovery Gains, Netflix and Disney+ Soften
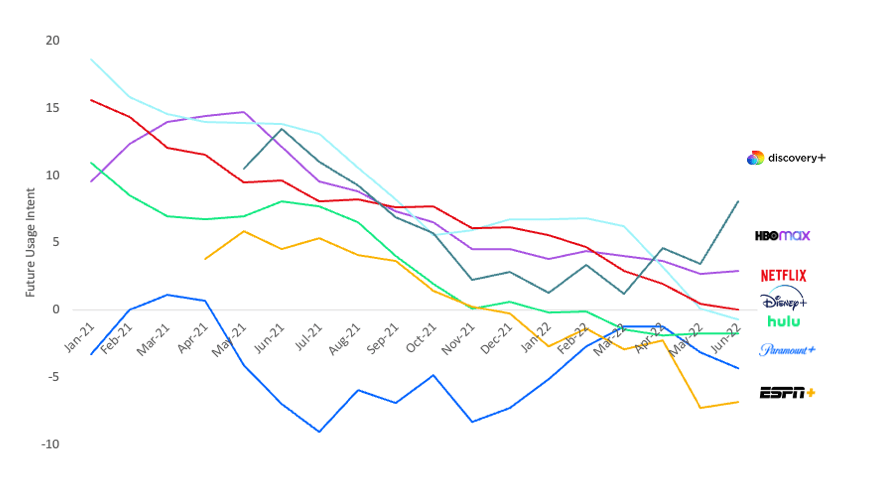
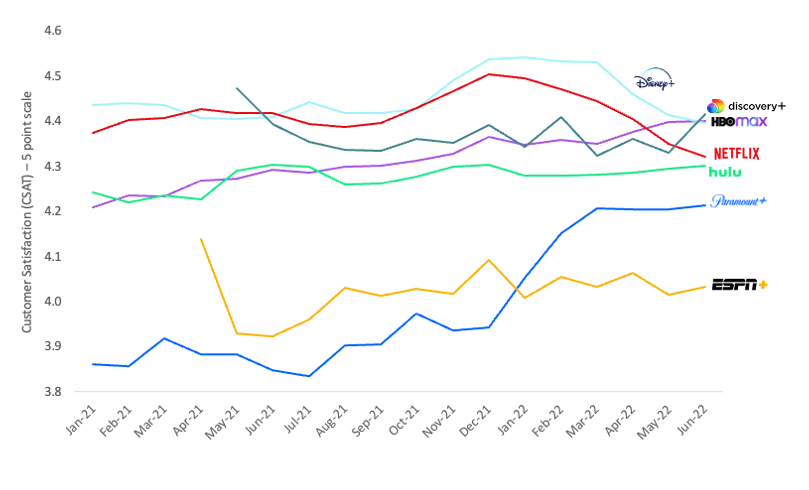
In our most recent data, HundredX notices potential strength at Discovery+ and sustained challenges for Netflix. We see Net Future Usage Intent for Discovery+ rising to the top for 2Q 2022, forging a notable gap above the #2 spot held by HBO Max. At the same time, Customer Satisfaction (CSAT) for Discovery+ has jumped from 4th among streamers to #1 in June 2022. Our data also reveals Disney+ dropping from its previously enjoyed lead in both CSAT and Future Usage Intent in 2022.
Further Struggles for Netflix?
Since Netflix’s last earnings report in April 2022, the company’s stock value has declined an additional 22%, with HundredX data showing both its CSAT and Net Future Usage Intent dropping further over the last few months.
We see customer sentiment on ‘Price’, the top selected driver by Netflix customers, continue its decline from 1Q 2022 into 2Q 2022. HundredX believes Netflix’s softness in subscriber growth may be attributed to several factors – including Netflix’s price increases as well as declining sentiment towards its value, content, and subscription options.
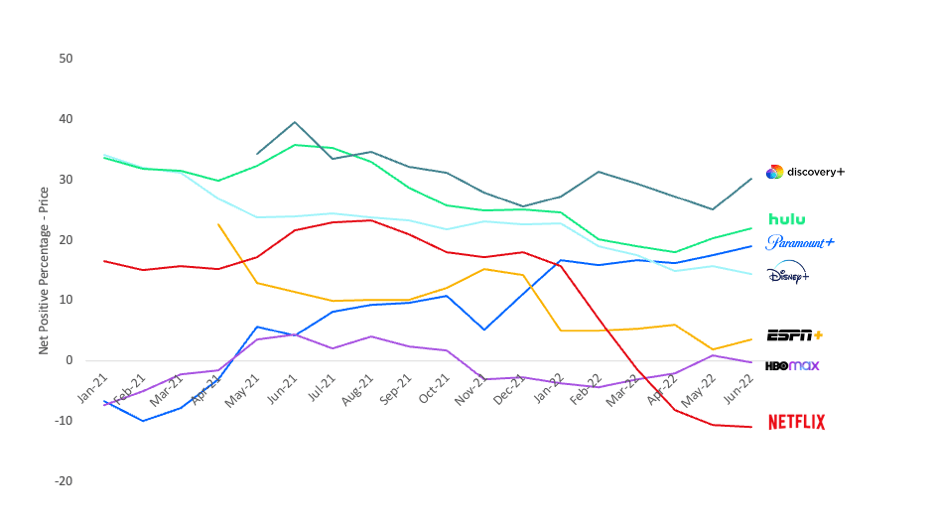
Relevant to yesterday's 2Q earnings call, HundredX data accurately captured both flattening of price and consumers' positive sentiment around content, reflecting management's comments.
For Those Still Watching…
The Net Positive Percentages (NPP) for ‘Value’ and ‘Programming Quality’, which represent the percentage of customers who view those factors as positives about Netflix’s service minus the percentage who see them as negatives, continue to drop for Netflix. It ranks in the bottom-half on both drivers among key streaming competitors. In contrast, Discovery+ continues to demonstrate strong traction with these drivers alongside most other streaming providers as detailed in our full analysis provided to HundredX clients.
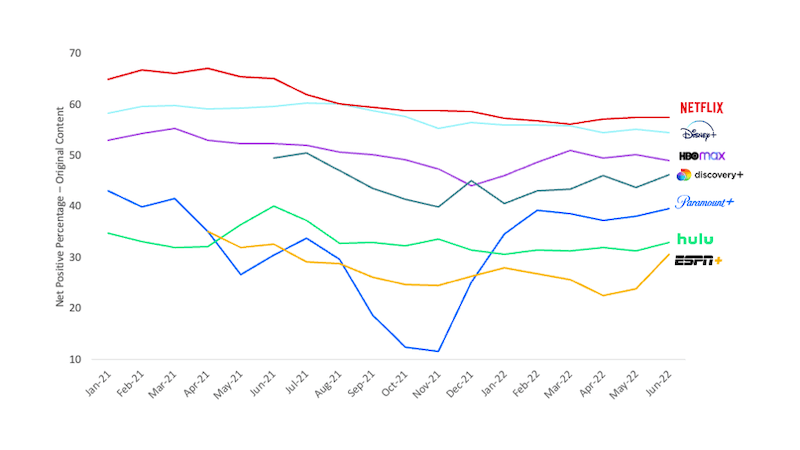
One place Netflix still sits atop sentiment for the streaming group for ‘Original Content’, perhaps in conjunction with the recent release of Season 4 of ‘Stranger Things’. We note, the top position for sentiment towards content could be in peril for Netflix.,Discovery+ has significantly narrowed the gap with Netflix this year on consumer views of the quality of its original content (see the chart below) and completely closed the gap on the amount of programming it offers – Discovery+ now only lags Disney+, contact us for further details.
HundredX data empowers both investor and corporate clients with strategies to grow market share. For our complete analysis on the Streaming Services Industry, or for more details on any of the providers referenced here, please reach out to the HundredX team: https://hundredx.com/contact
Strategy Made Smarter
HundredX works with a variety of companies and their investors to answer some of the most important strategy questions in business:
- Where are customers "migrating"?
- What are they saying they will use more of in the next 12 months?
- What are the key drivers of their purchase decisions and financial outcomes?
Current clients see immediate benefits across multiple areas including strategy, finance, operations, pricing, investing, and marketing.
Our insights enable business leaders to define and identify specific drivers and decisions enabling them to grow their market share.
Please contact our team to learn more about which businesses across 75 industries are best positioned with customers and the decisions you can make to grow your brand’s market share.


