After looking at airlines earlier this month, HundredX navigates to hotels and cruise lines for the next leg of our mid-summer updates on the travel sector.
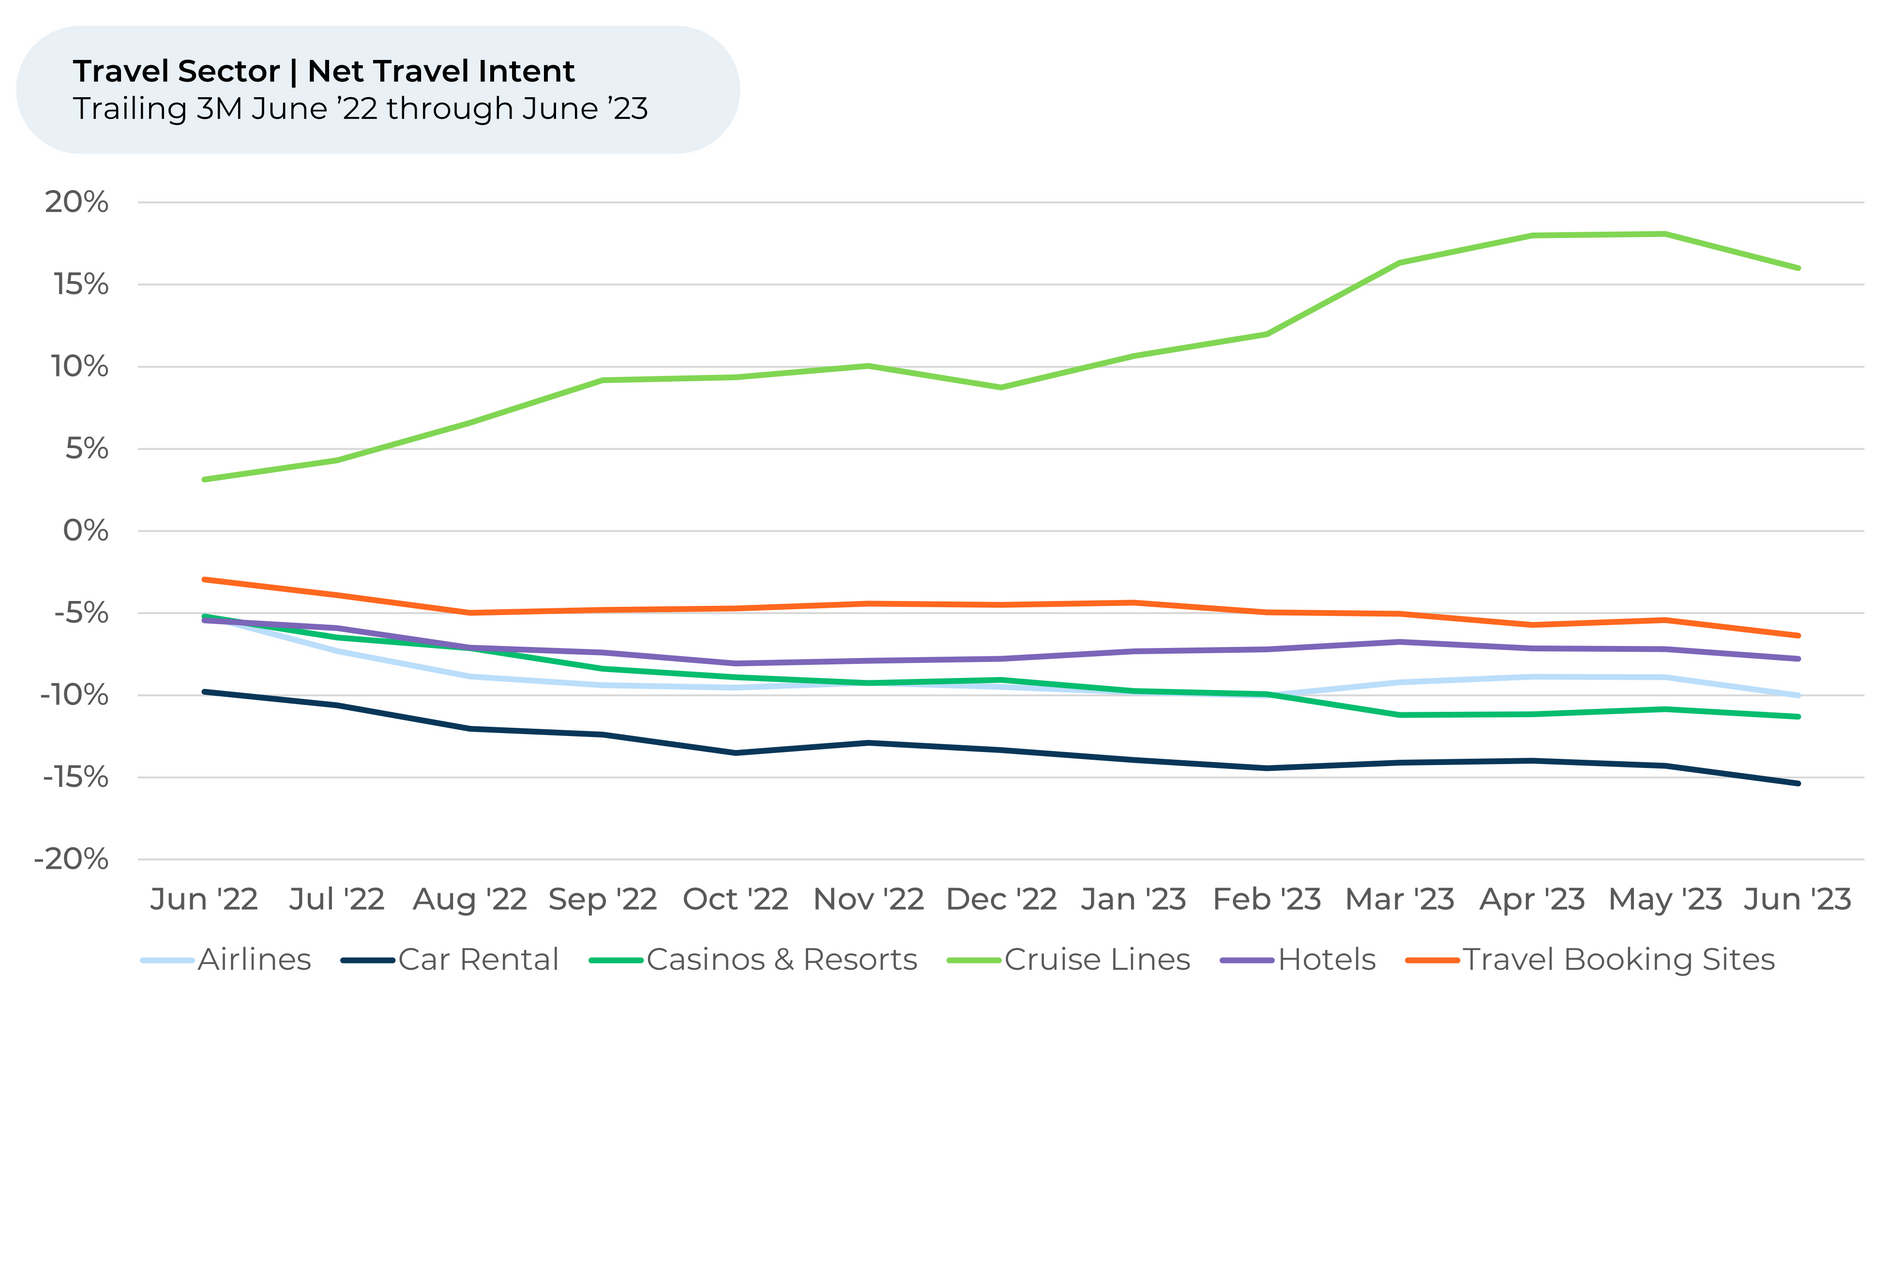
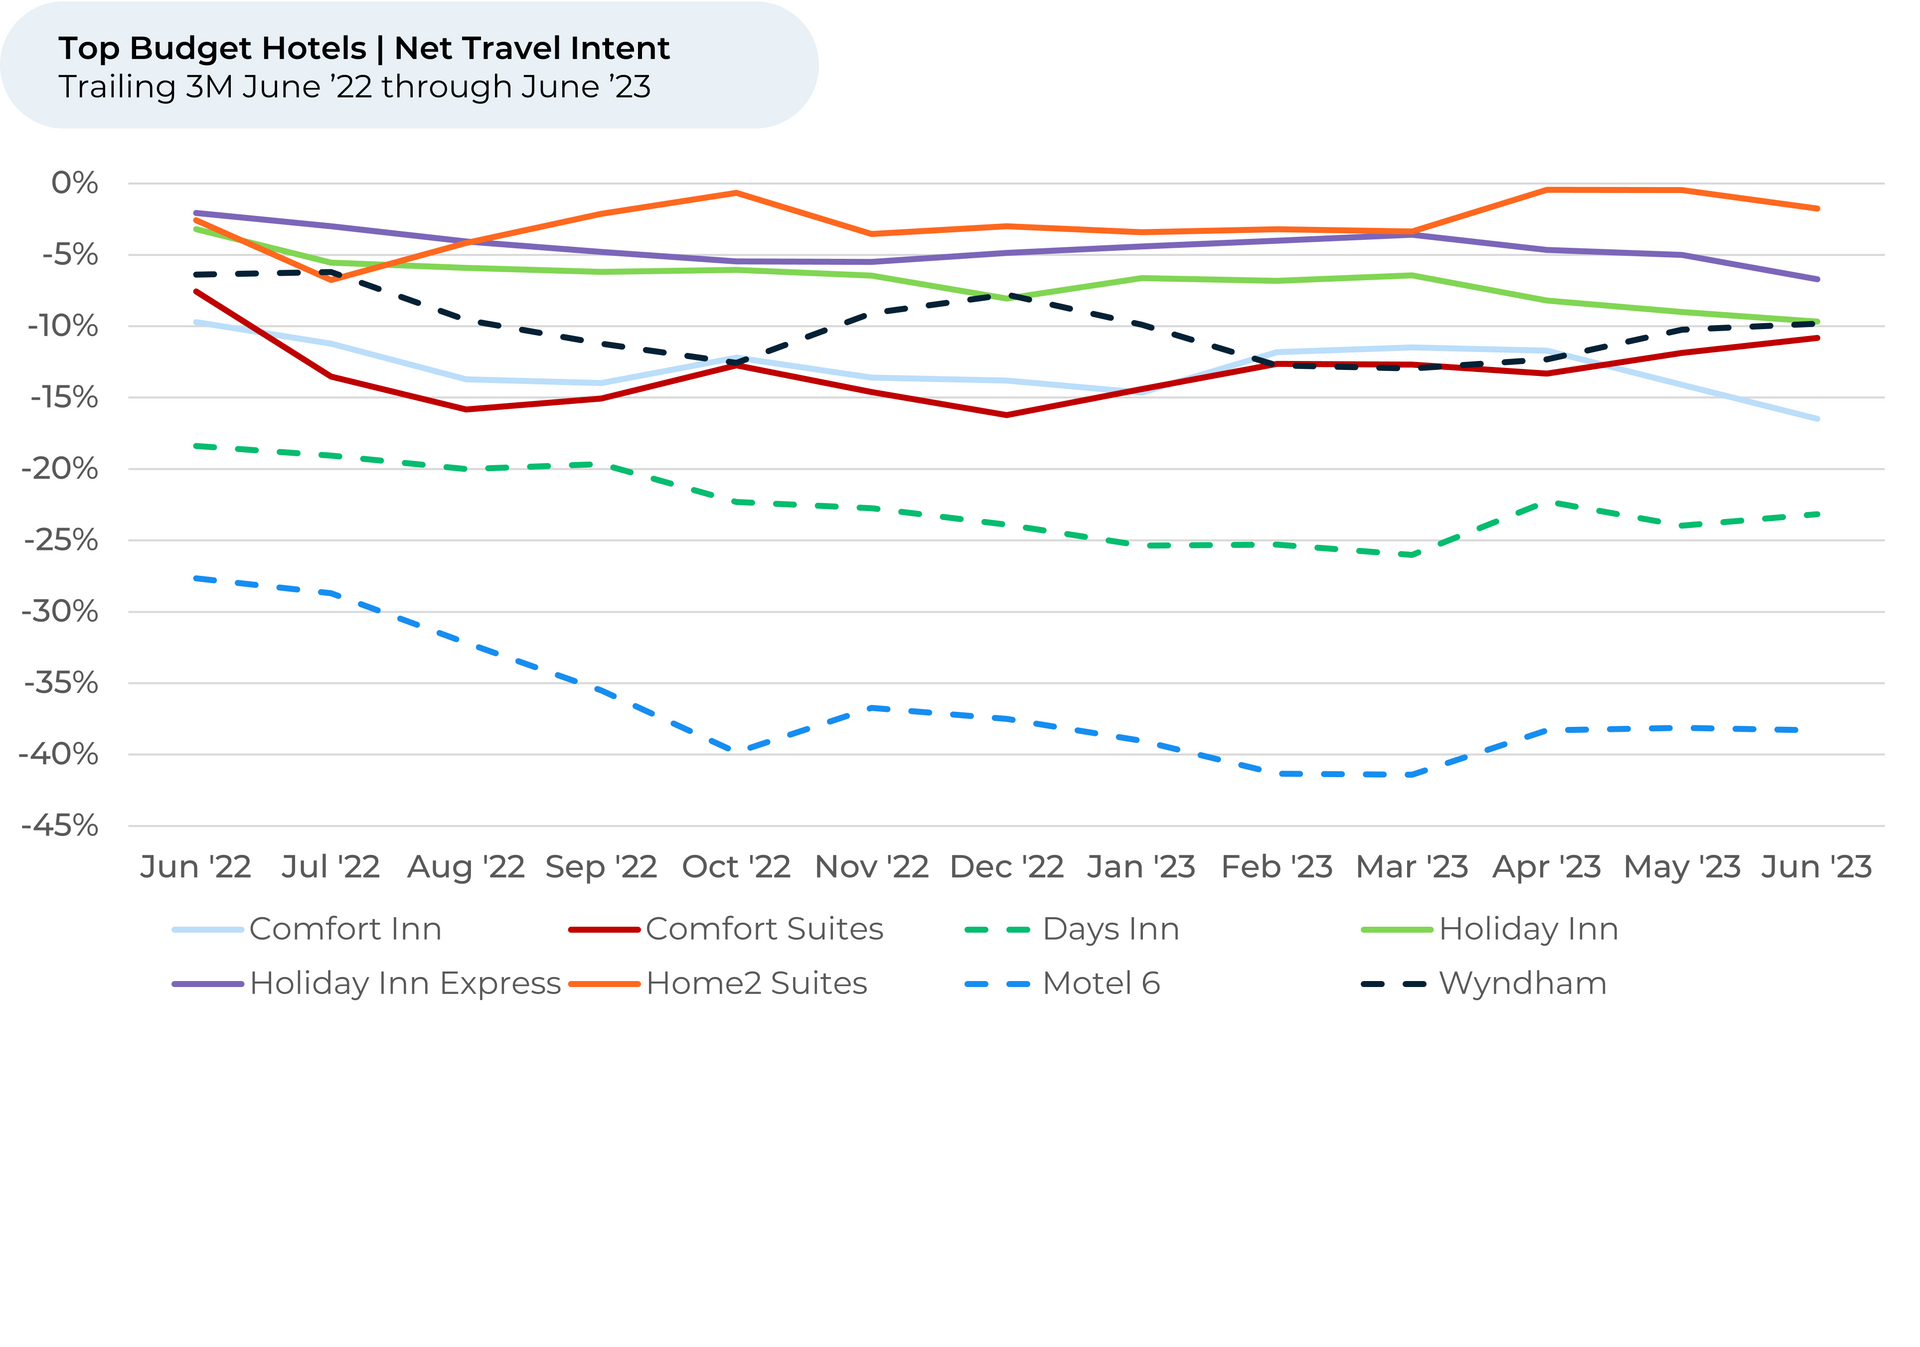
Looking to “The Crowd” of travelers, we find customers aren’t souring on budget hotels, but they are starting to lose interest in cruises.
Analyzing over 280,000 pieces of real traveler feedback (including 90,000 across 79 hotels and 18,000 across 18 cruise lines) from June 2022 through June 2023, HundredX discovers:
Key Takeaways
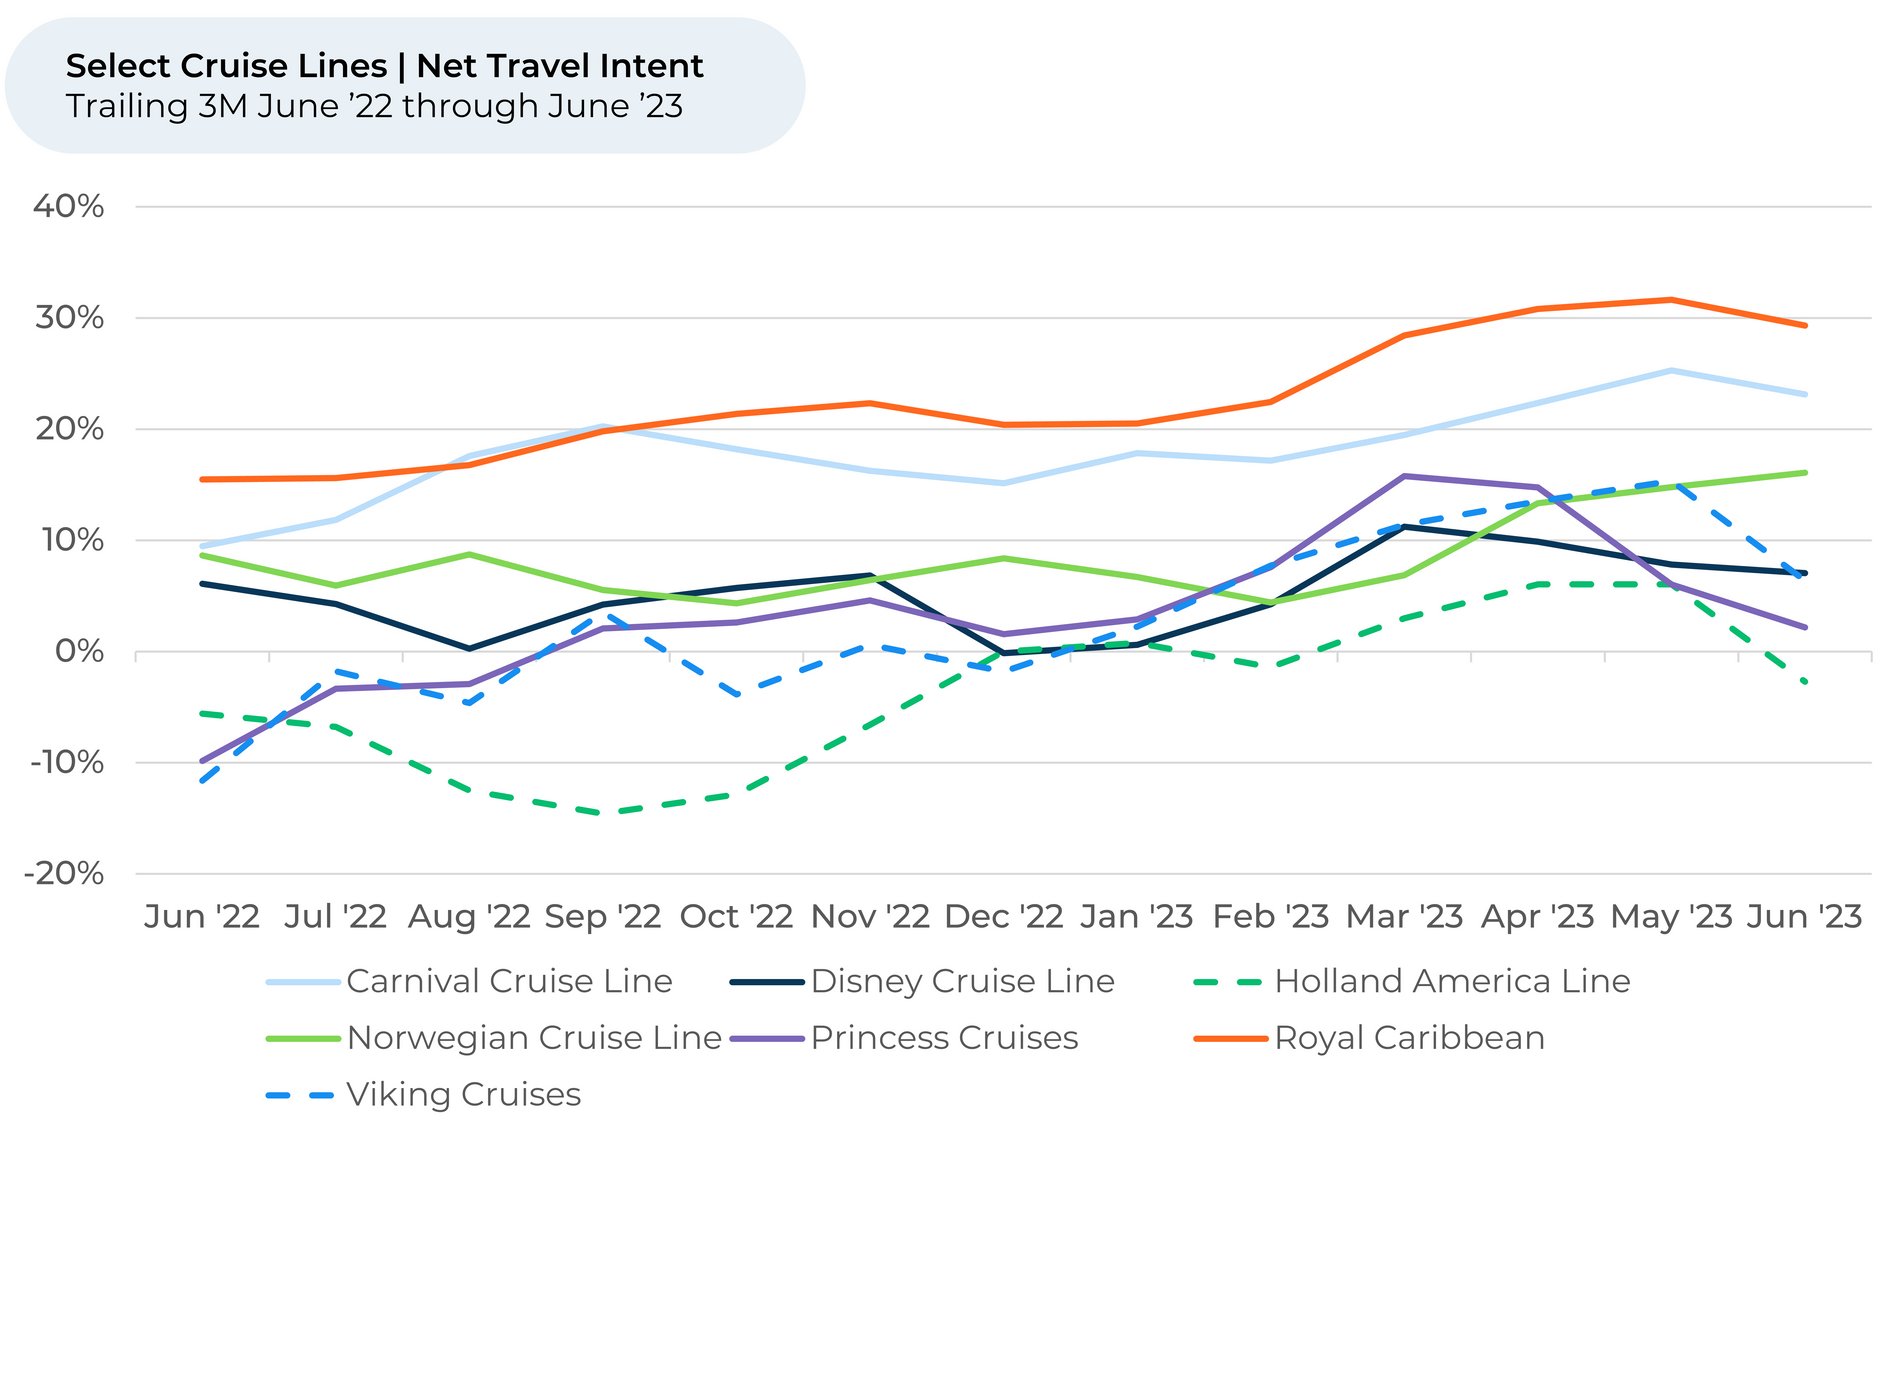
- With the summer halfway over, travelers finally seem less interested in cruises. For the first time in 2023, Travel Intent1,2 dipped for cruise lines in June (-2%). Norwegian (+1%) and Disney (-1%) were most resilient.
- While Travel Intent fell the most (-4%) for cruisers in their 40s and over 60, the 3% dip for 18–29-year-olds reverses that group’s 1H 2023 spike driven by attractive pricing.
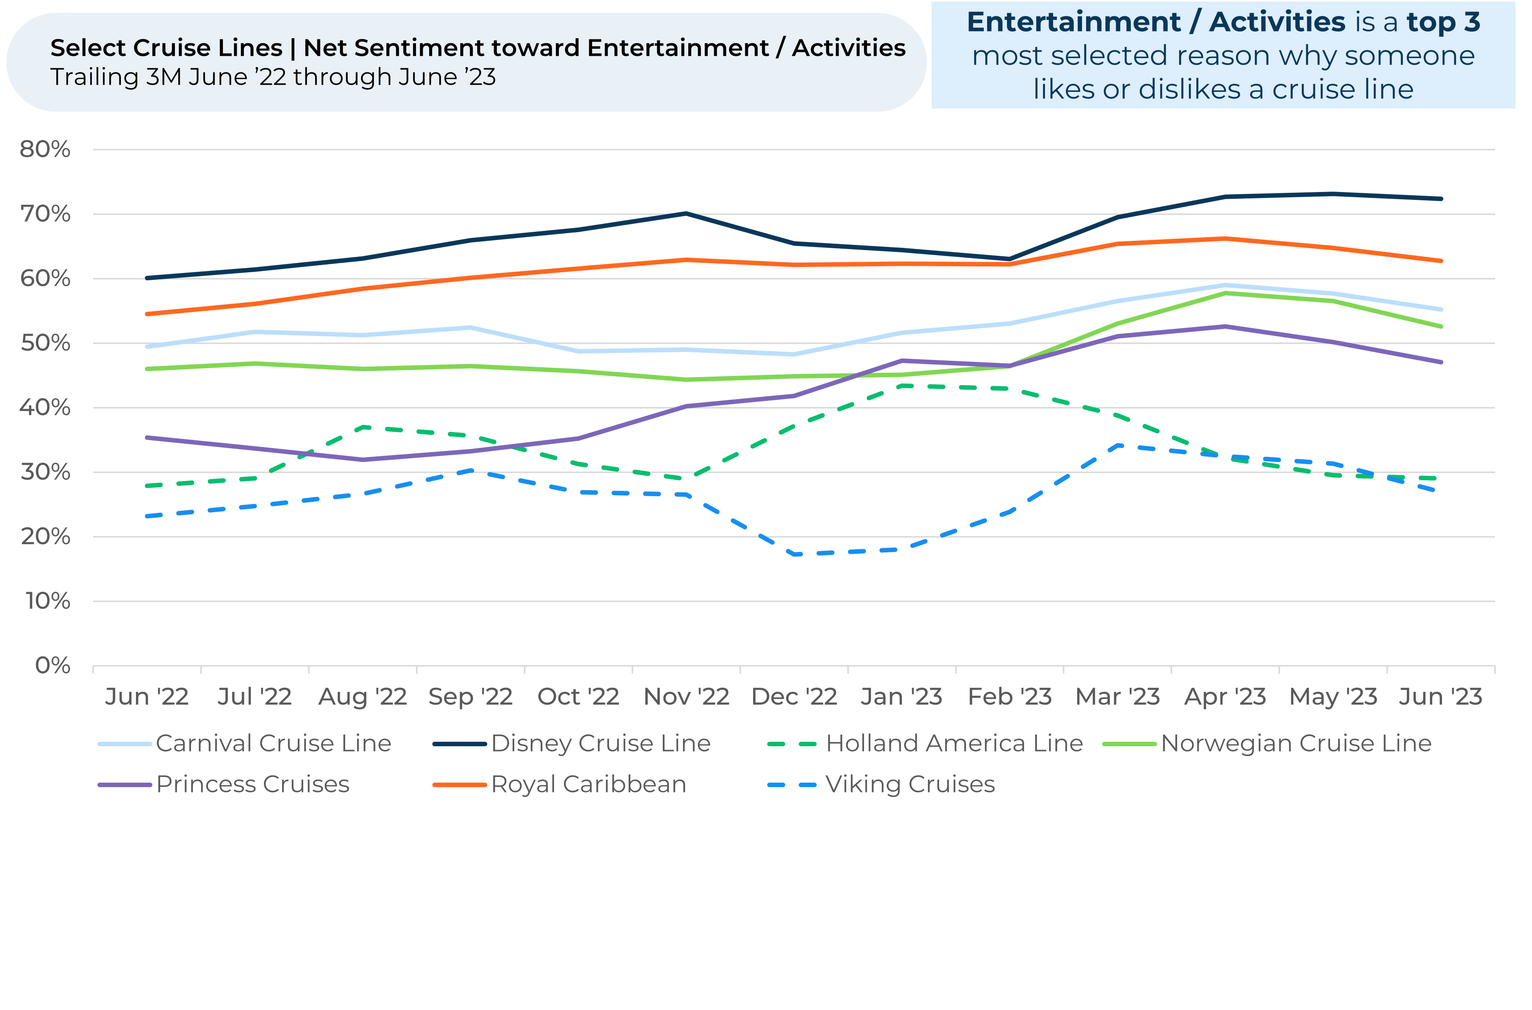
- Our proprietary, AI-driven Resource Allocation model indicates Viking Cruises and Holland America may want to improve the entertainment and activities offered on their lines to help regain recent Travel Intent losses. Both lines dipped more in Travel Intent (9% each) over the past month compared to competing lines.
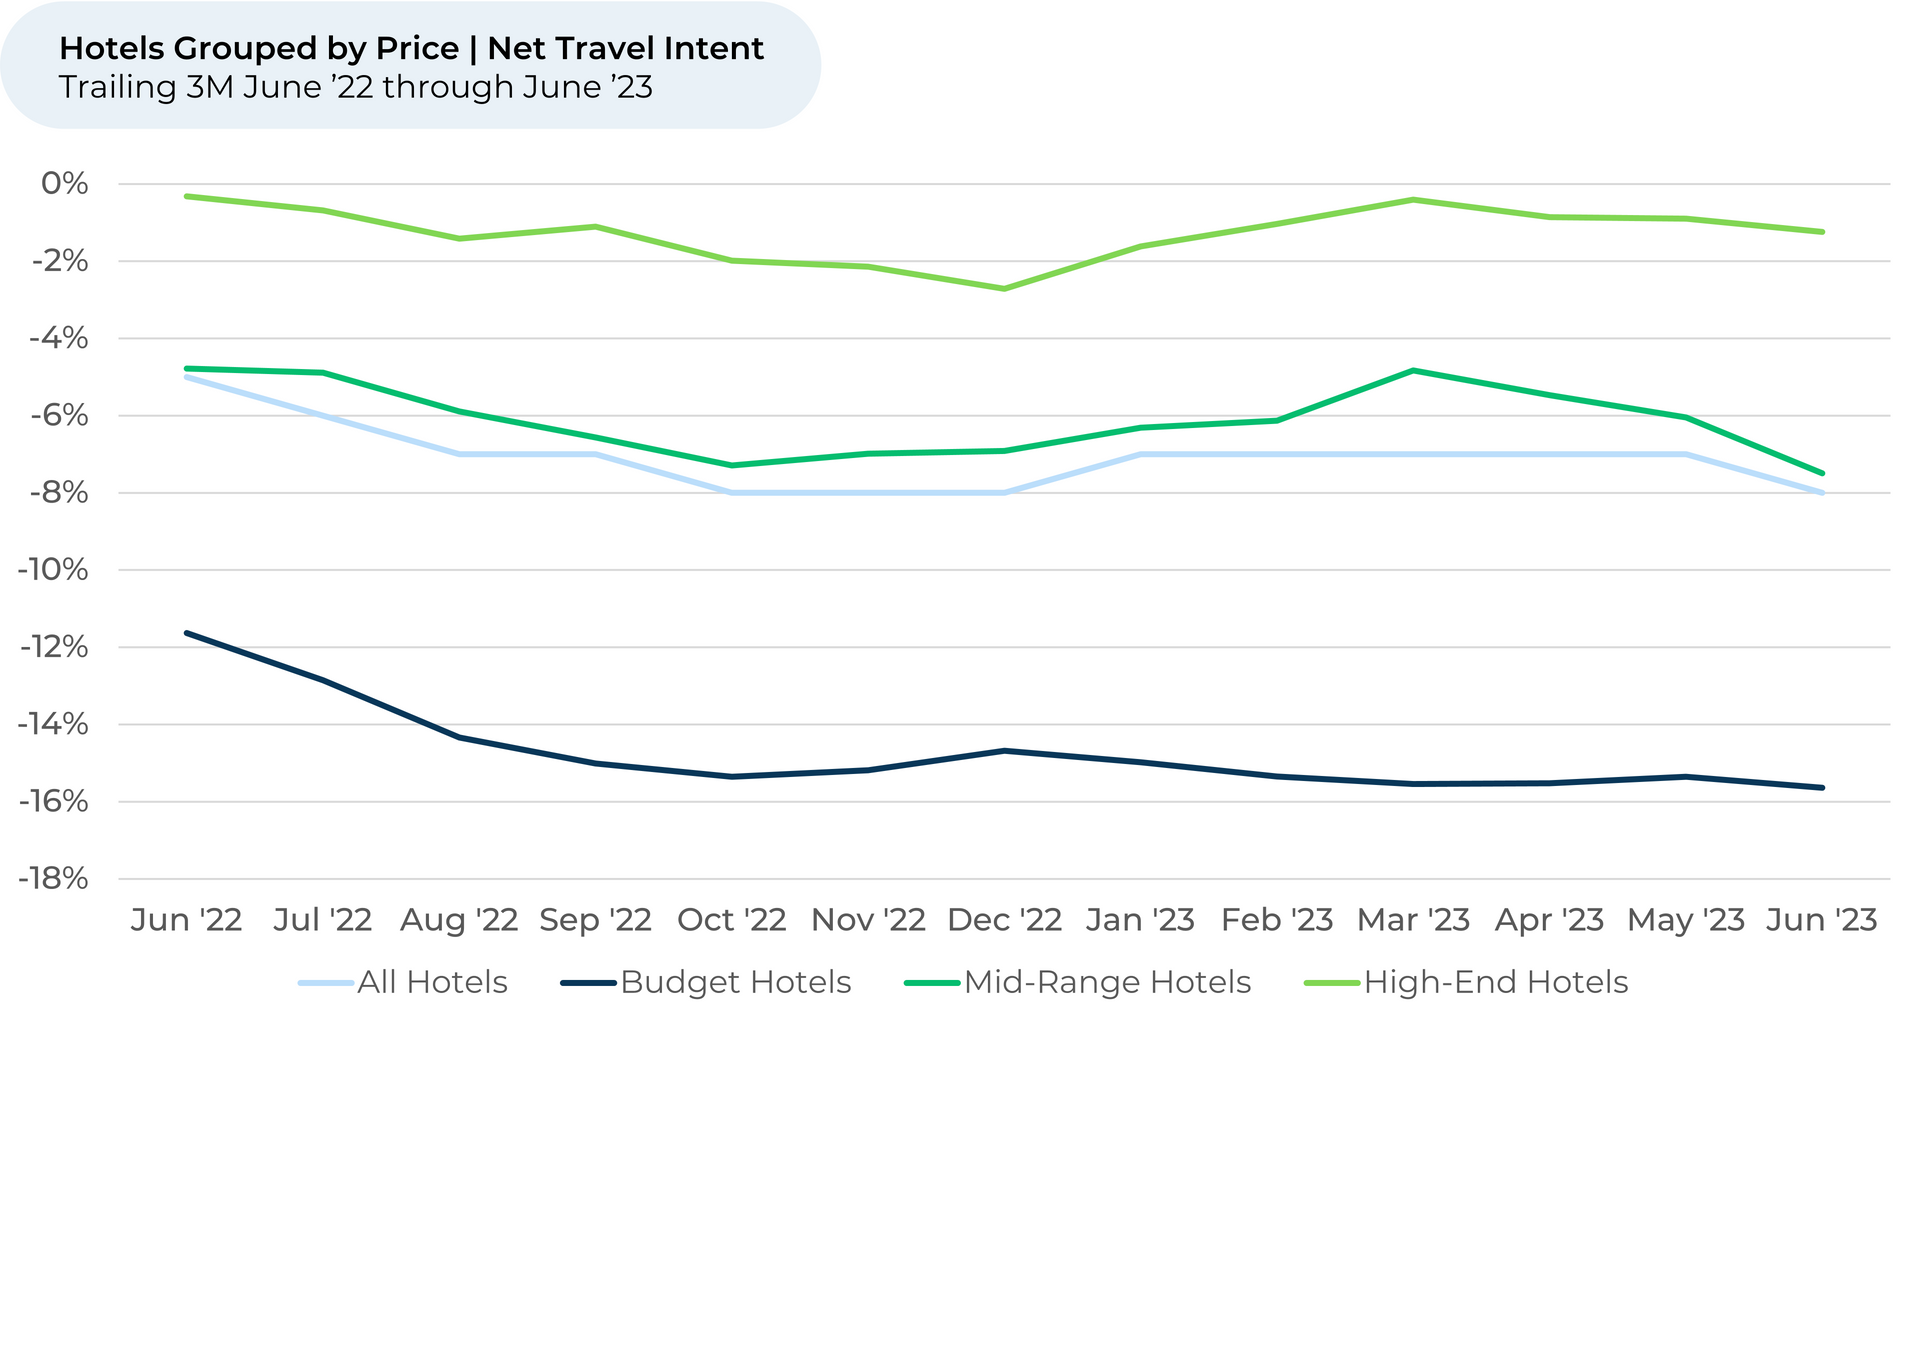
- Travel intent for budget hotels is remaining more stable than mid-range and high-end hotels the last three months. It was flat in June relative to March for budget hotels vs. -3% for mid-range and -1% for high-end hotels. Travel Intent for budget hotels continues to lag peers overall.
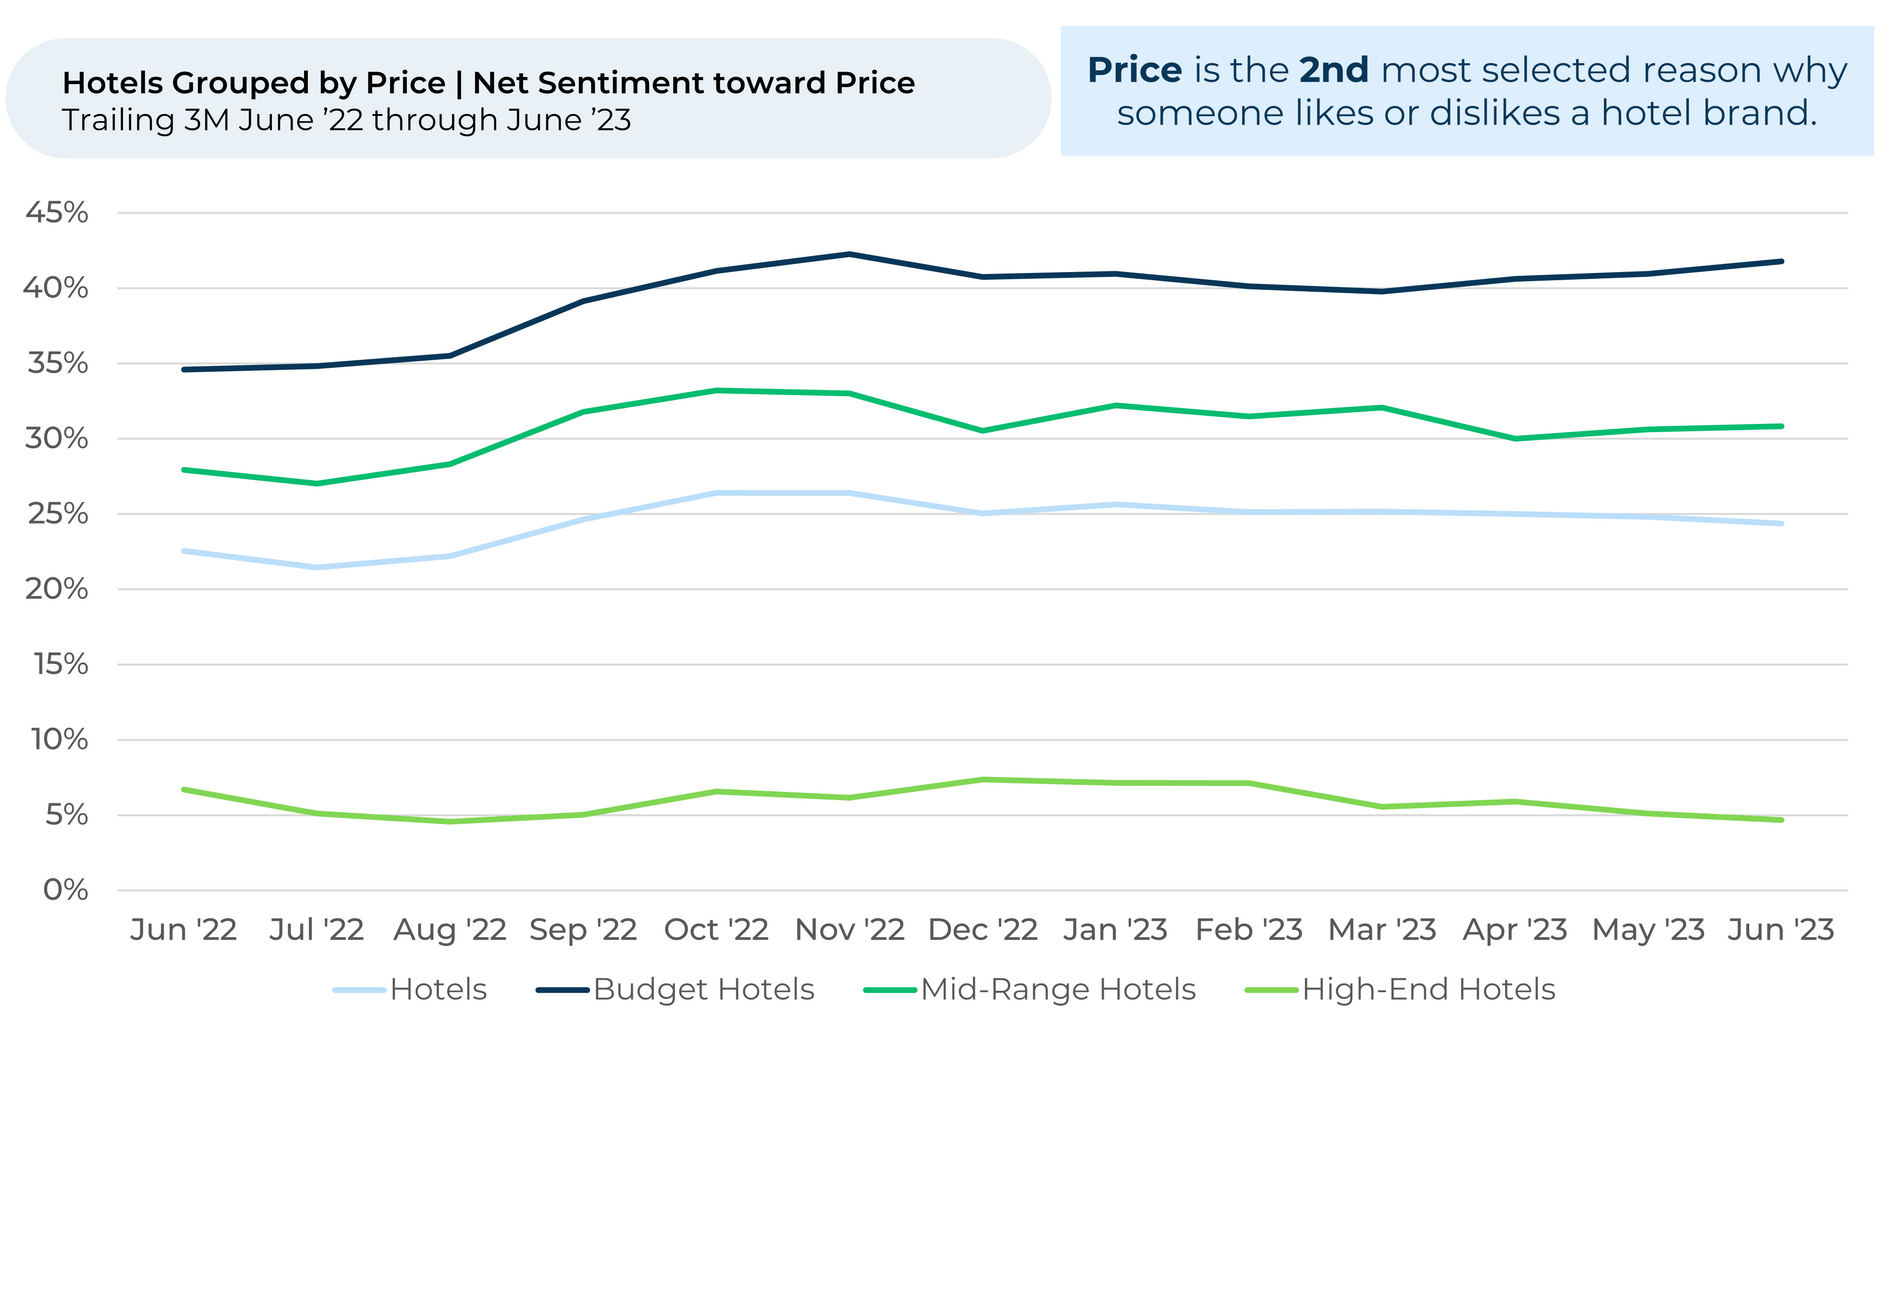
- Customer net sentiment3 towards prices is up for budget hotels and down for other levels over the last three months.
Discover HundredX insights into Travel Trends:
Please contact our team for a deeper look at HundredX's travel data, which includes more than 600,000 pieces of customer feedback across more than 180 travel-related brands.
- All metrics presented, including Net Travel Intent (Travel Intent), and Net Positive Percent / Net Sentiment are presented on a trailing three-month basis unless otherwise noted.
- Travel Intent for most Travel subsectors represents the percentage of customers who expect to travel more with or spend more with that brand over the next 12 months, minus those that intend to travel or spend less. We find businesses that see Travel Intent trends gain versus the industry have often seen revenue growth rates, margins and/or market share also improve versus peers.
- HundredX measures sentiment towards a driver of customer satisfaction as Net Positive Percent (NPP), which is the percentage of customers who view a factor as a positive (reason they liked the products, people, or experiences) minus the percentage who see the same factor as a negative.
Strategy Made Smarter
HundredX works with a variety of companies and their investors to answer some of the most important strategy questions in business:
- Where are customers "migrating"?
- What are they saying they will use more of in the next 12 months?
- What are the key drivers of their purchase decisions and financial outcomes?
Current clients see immediate benefits across multiple areas including strategy, finance, operations, pricing, investing, and marketing.
Our insights enable business leaders to define and identify specific drivers and decisions enabling them to grow their market share.
Please contact our team to learn more about which businesses across 75 industries are best positioned with customers and the decisions you can make to grow your brand’s market share.
####
HundredX is a mission-based data and insights provider. HundredX does not make investment recommendations. However, we believe in the wisdom of the crowd to inform the outlook for businesses and industries. For more info on specific drivers of customer satisfaction, other companies within 75+ other industries we cover, or if you'd like to learn more about using Data for Good, please reach out: https://hundredx.com/contact.

