As we monitor one of the busiest times of the year for Entertainment, we look to The Crowd to get a read on sectors leading in Usage Intent.
- Our Electronics & Media coverage continues to see lower Usage intent.
- Music Streaming services is the only sector with Usage intent that is both positive and up during the last three months. Spotify remains the leader.
- As many services raise prices, free platform myTuner Radio saw a spike in Usage intent over the last three months.
Leveraging HundredX’s proprietary listening methodology, we evaluate more than 230,000 pieces of feedback from real customer experiences across the country. We use that data for insights into customers’ future Usage Intent,1 changing demands for Streaming & Media brands, and which companies look to benefit most. Usage is correlated with share of time spent and retention, which can be a leading indicator of market share.
Usage Intent Leaders
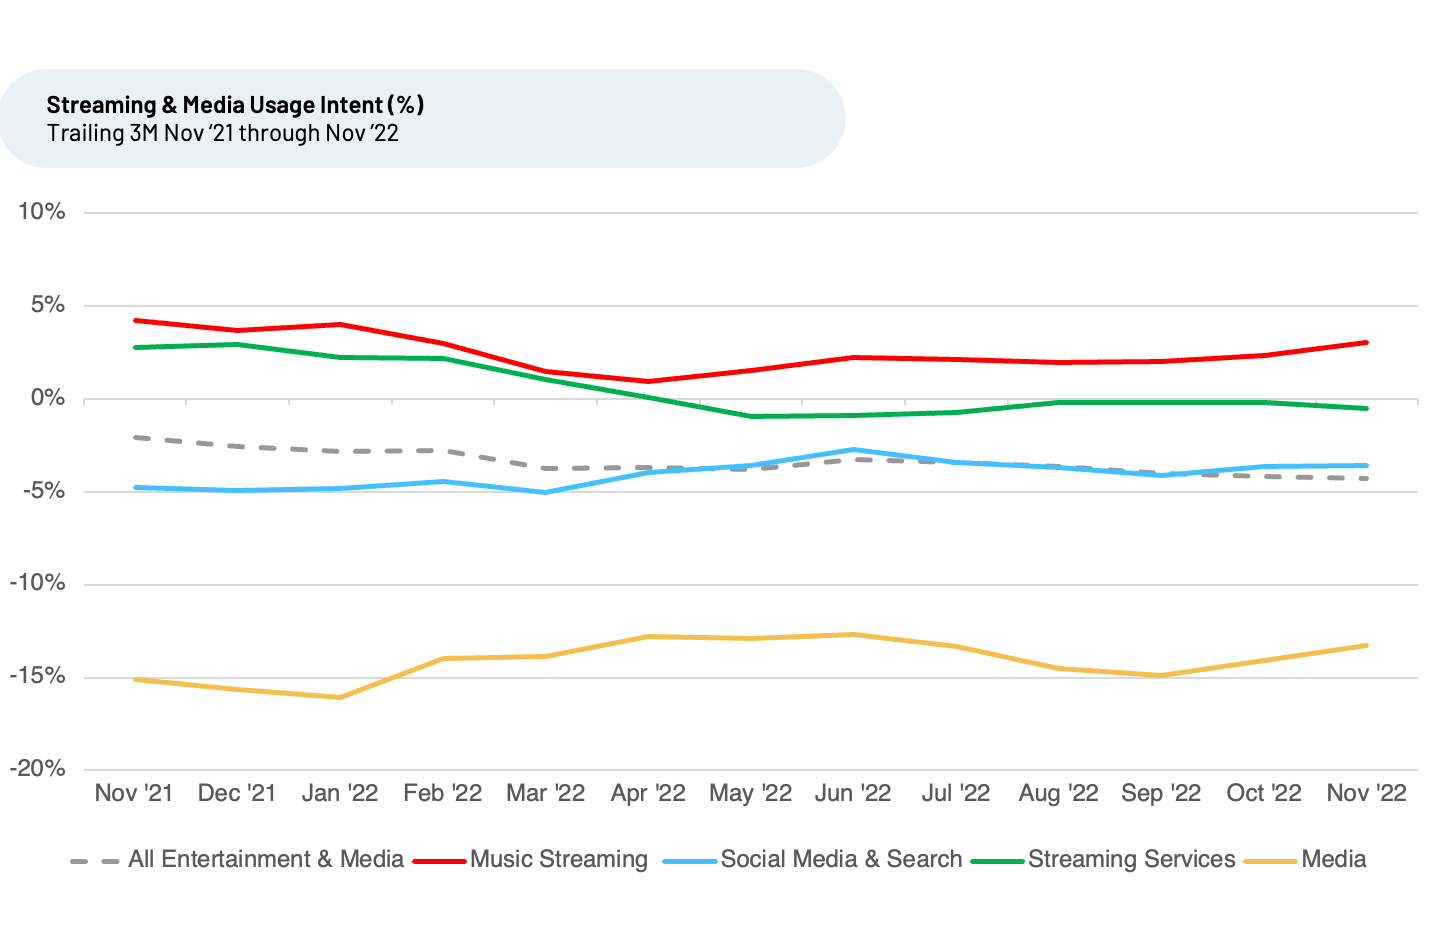
Usage intent for the broader Entertainment & Media sector remained stable at -4% in November 2022, and in the -3% to -4% range during the last year. We observe positive trends for specific companies within Search and Music Streaming. Overall usage intent for Music Streaming remained steady at 3% in November 2022, after hitting a low of 1% in April 2022.
Usage intent reflects the percentage of customers who plan to use a specific brand during the next 12 months minus the percentage that plan to use less.
The Crowd tells us that they intend to use the following brands more.
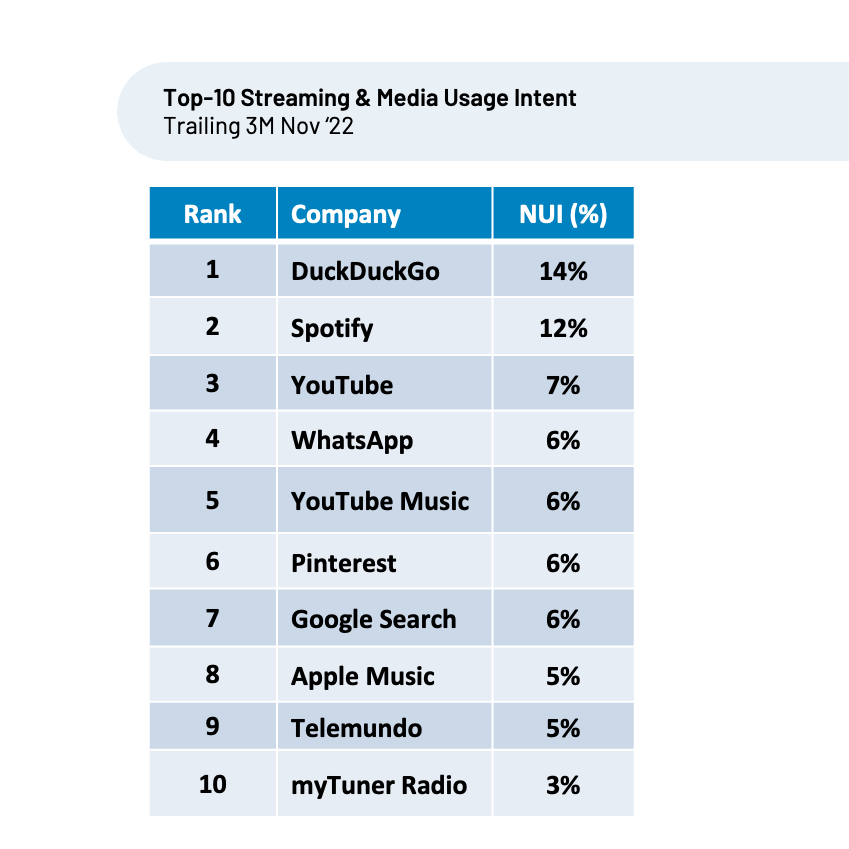
DuckDuckGo, the current Usage intent leader, increased from 12% in May 2022 to 17% September 2022, though it dropped to 14% in November 2022. For our Social Media and Search coverage, DuckDuckGo’s user satisfaction ranks #1 for the group by far on privacy, the amount of advertising, and the value provided. Customer sentiment towards “Privacy” and “Ads” are 78% and 43% ahead of covered peers, respectively. “A cool technology program that has built its name on trust and security,” commented one satisfied customer. Another told HundredX, “This app is great!! Gives you results for any search with minimal ads and links to stuff you don't want to see!”
HundredX measures sentiment toward a driver of customer satisfaction as the percentage of customers who say that factor is a reason they like the brand/product minus the percentage who say it is a reason they do not like it.
After DuckDuckGo, Music Streaming companies lead Entertainment Usage Intent overall, with Spotify, YouTube Music, Apple Music, and myTuner Radio all showing continued positive Usage Intent during the past few months. Top drivers of satisfaction with Streaming Music brands are Music Selection, Ease of Use, Sound Quality, and App.
Spotify remains the market share leader. For the third quarter 2022, Spotify reported 195 million paid subscribers in the third quarter of 2022, up from 188 million paid or premium subscribers in the previous quarter and above expectations. Spotify’s Usage Intent has been pretty stable over the past year, rising slightly to 12% in November 2022. Spotify ranks #1 in Music Streaming for customer satisfaction with 13 of the 16 satisfaction drivers we track. Customers are most satisfied with Spotify’s Music Selection, Ease of Use, Sounds Quality, Personalization, Navigation, and App. One satisfied customer recently commented, “I personally use it for podcasts and I enjoy how easy it is to maneuver throughout the app.” Another mentioned, “Absolutely love Spotify and its wide selection of music choices. So easy to use across different devices, and I like how easy it is to share playlists and songs with friends.”
During recessionary periods, people tend to spend less money outside their homes, and more within, including home entertainment and media. We will monitor these brands as the economic environment continues to evolve for Usage Intent changes.
Top Usage Intent Movers
myTuner Radio, WeChat, and WhatsApp saw the largest three-month increases in Usage Intent, August to November 2022, of the Media, Streaming, Social Media and Search businesses we cover. We find brands that see their spread in Usage Intent improve vs. peers tend to see stronger growth rates and market share gain.
As streaming subscription prices continue to rise (e.g., Apple Music), brands with free services such as myTuner Radio are poised to potentially gain share. myTuner surged by 28%, from -23% usage intent in September to +3% in November 2022. myTuner provides free and ad-based streaming radio services via its app. myTuner saw the greatest improvements in customer sentiment towards its Music Selection, Design, and Integrations with other technology. One recent customer commented, “It’s free and you can find radio stations from all over the country. No static!”
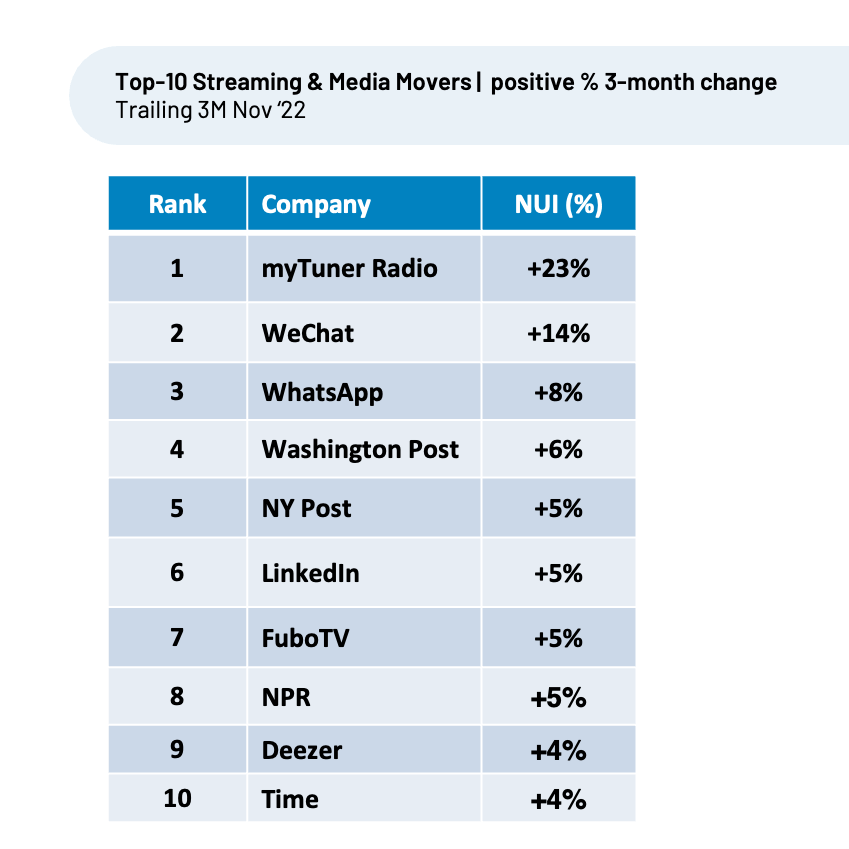
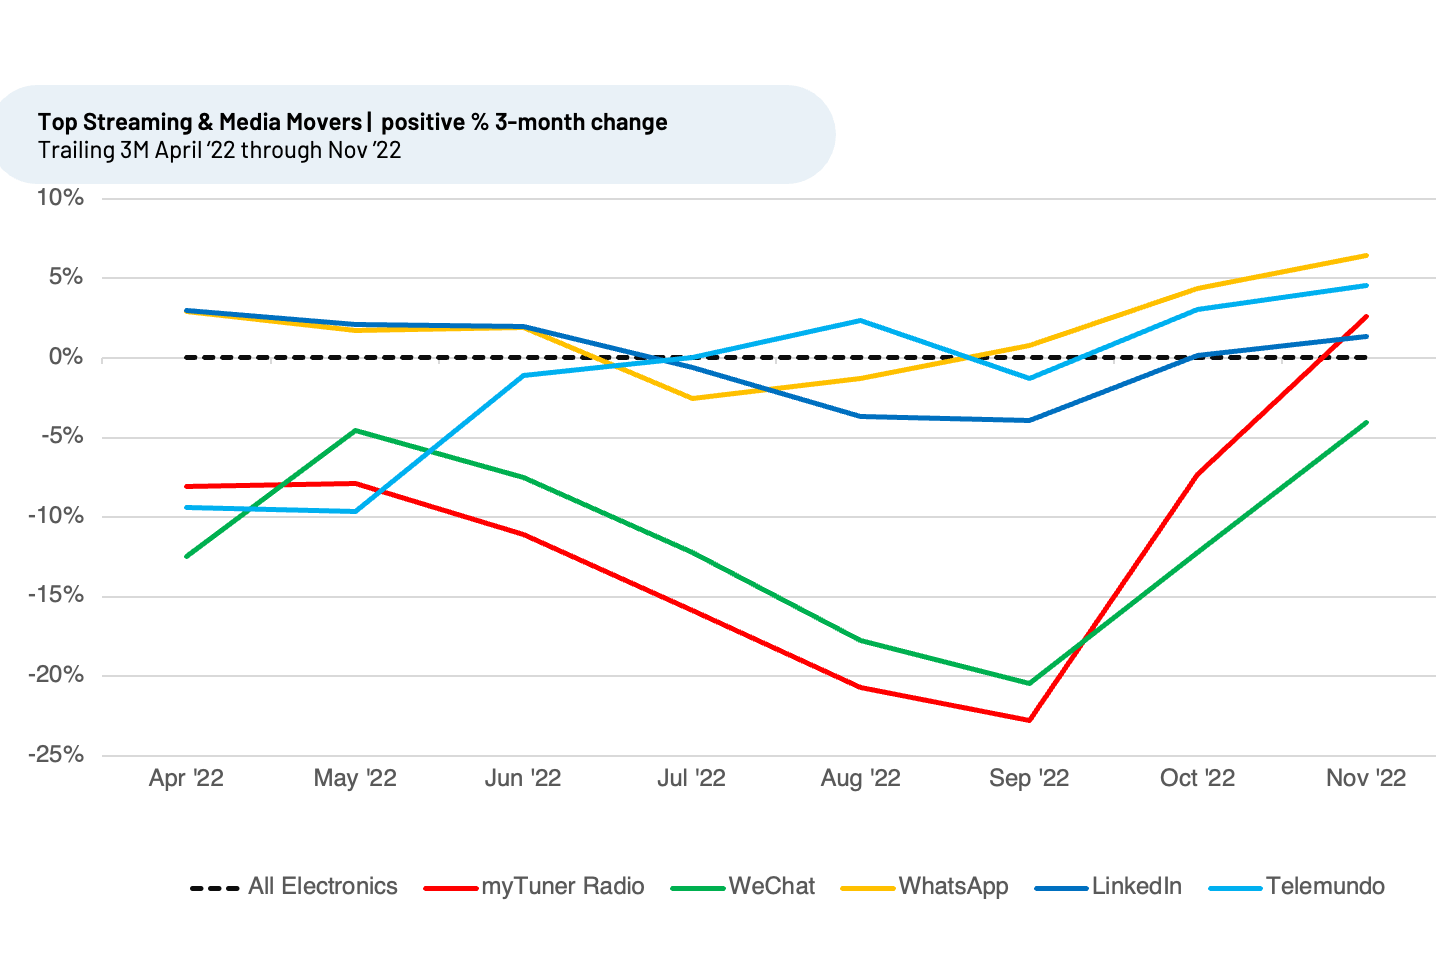
Messaging service providers WeChat and WhatsApp improved again this month, bringing their 3-month changes to +14% and +8%, respectively.
WeChat is a Chinese instant messaging, social media, and mobile payment app. First released in 2011, it became the world's largest standalone mobile app in 2018, with over 1.24 billion active users. Most users live in China, but its presence is worldwide. Usage intent rose to -4% in November 2022, up from -20% in September 2022. Customer satisfaction in the last three months rose the most with its Messaging (up 40%). A recent comment from a happy Asian customer, “So convenient to connect with family and friend all around the world.” Another customer who is not Asian shared, “I use this app to stay in touch with friends in China.”
The Crowd tells us that the overall outlook for usage intent for streaming and media businesses is mixed, with select brands that save users money, protect their privacy and doing a better job of connecting them to friends and family gaining market share. We continue to monitor trends within Streaming and Media for the changes that will emerge in 2023.
1All metrics presented, including Net Usage Intent (Usage Intent), and Net Positive Percent / Sentiment
are presented on a trailing three-month basis, unless otherwise noted.
Strategy Made Smarter
HundredX works with a variety of companies and their investors to answer some of the most important strategy questions in business:
- Where are customers "migrating"?
- What are they saying they will use more of in the next 12 months?
- What are the key drivers of their purchase decisions and financial outcomes?
Current clients see immediate benefits across multiple areas including strategy, finance, operations, pricing, investing, and marketing.
Our insights enable business leaders to define and identify specific drivers and decisions enabling them to grow their market share.
Please contact our team to learn more about which businesses across 75 industries are best positioned with customers and the decisions you can make to grow your brand’s market share.
####
HundredX is a mission-based data and insights provider. HundredX does not make investment recommendations. However, we believe in the wisdom of the crowd to inform the outlook for businesses and industries. For more info on our data solutions, other brands within 75+ other industries we cover, or if you'd like to learn more about using Data for Good, please reach out: https://hundredx.com/contact.


