A blue and white logo for hundredx on a white background
A person is holding a remote control in front of a television.
Apple tv + 's original content pleases viewers , while netflix takes a small hit over new account sharing policy.

The video streaming industry has had a busy few months. HBO Max and Discovery+ came together to form Max, Paramount+ folded Showtime into its service, and Netflix finally introduced additional fees to share accounts outside of your household in the U.S. 


Looking to “The Crowd” of streaming viewers, HundredX details how real customers view some of these changes and how their opinions could continue to shape the industry. 


After analyzing more than half a million pieces of feedback in the entertainment sector, including 100,000 across 22 video streaming services, we find:

Key Takeaways

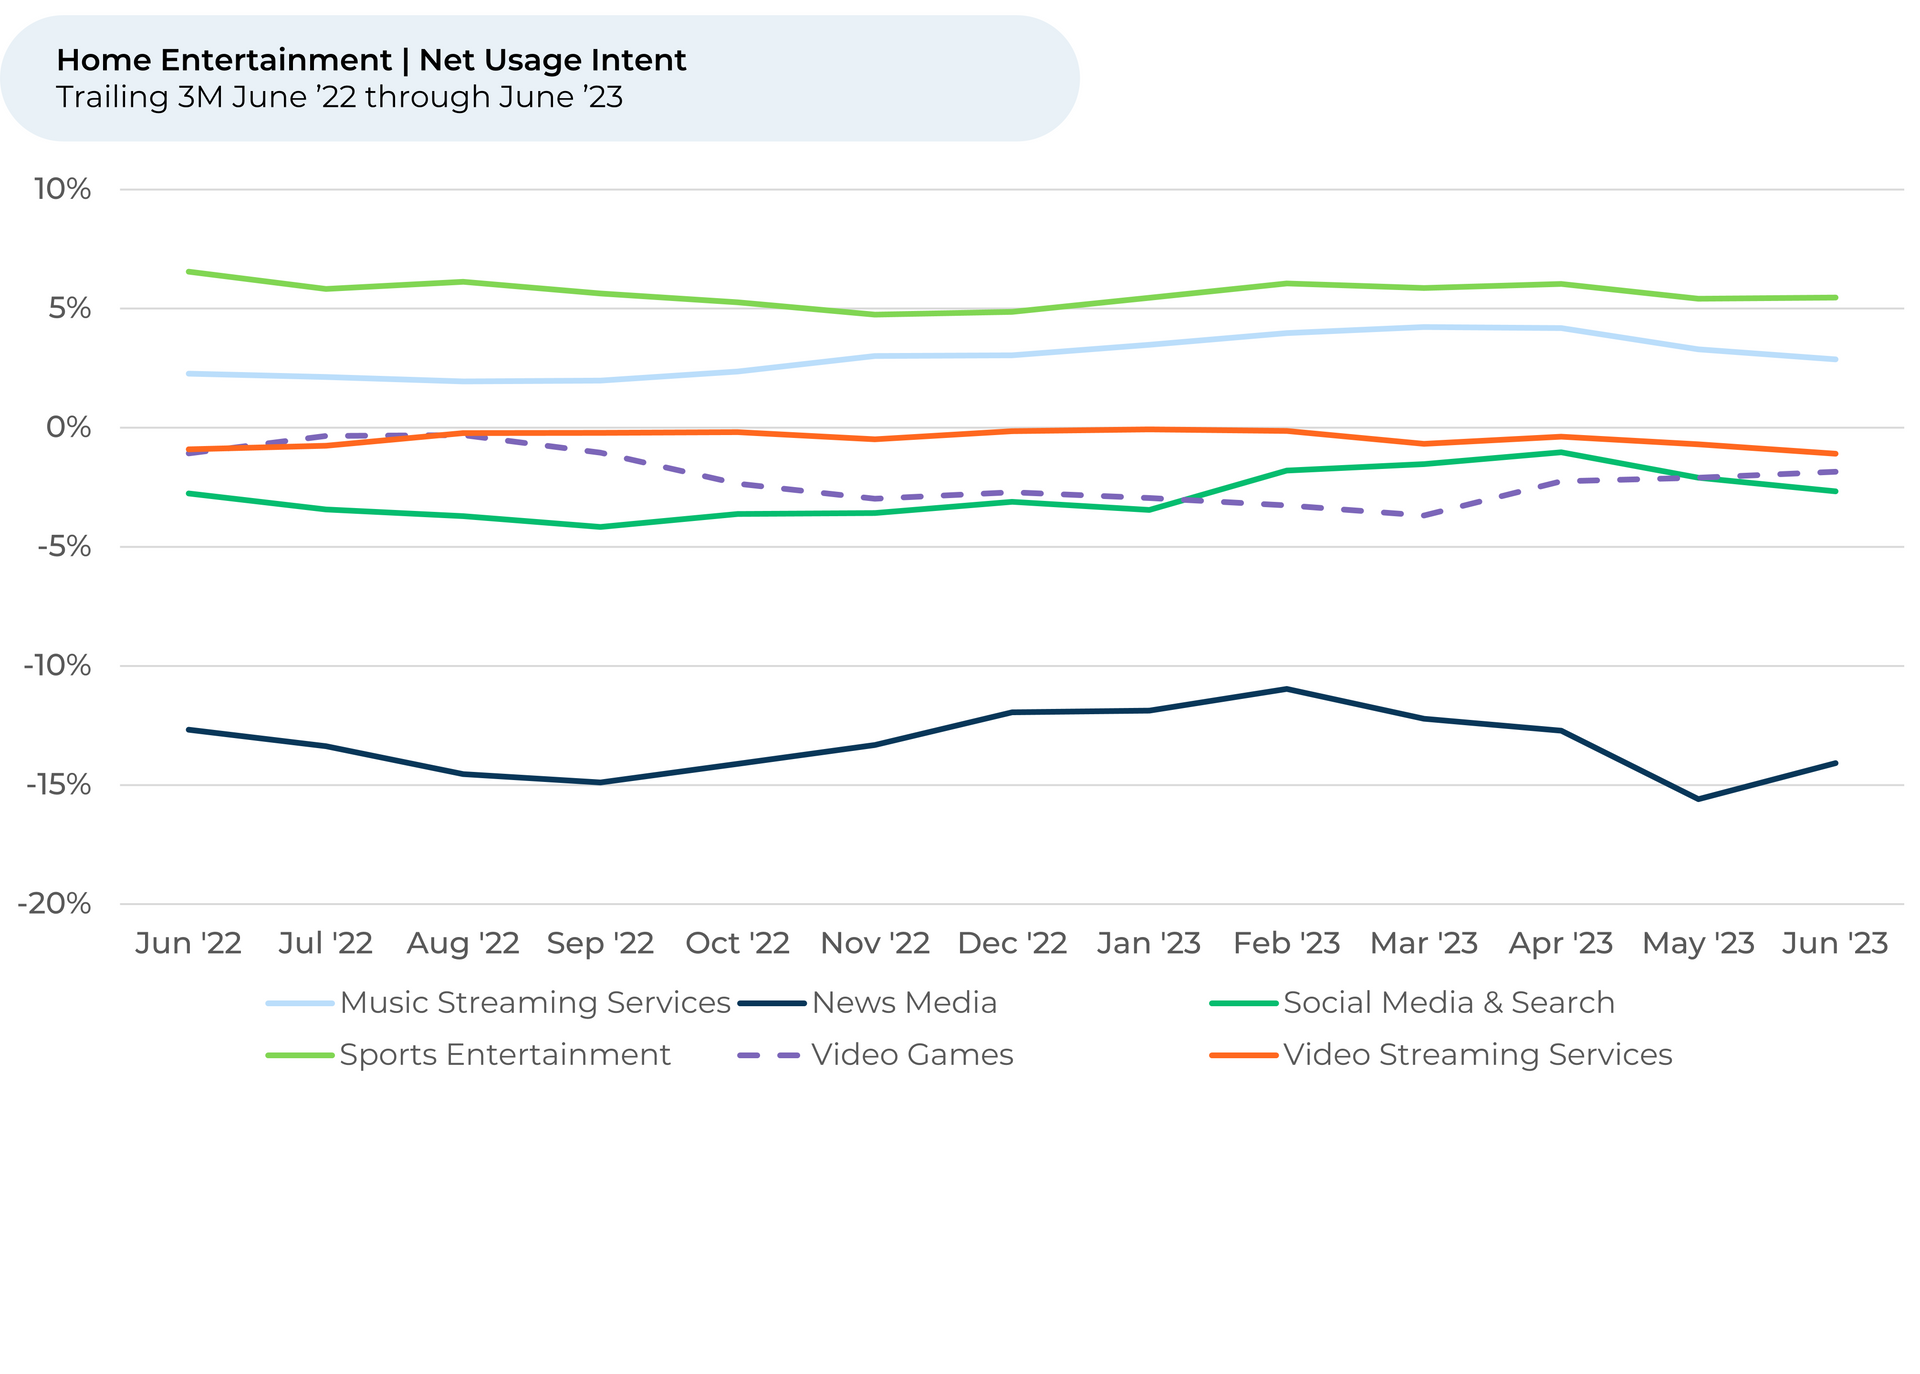
  • Usage Intent for video streaming was more resilient than all other areas of entertainment but video games, flat over the last three months vs. 1%-2% declines for areas like social media, music streaming, and news media. Video games was up 2%.
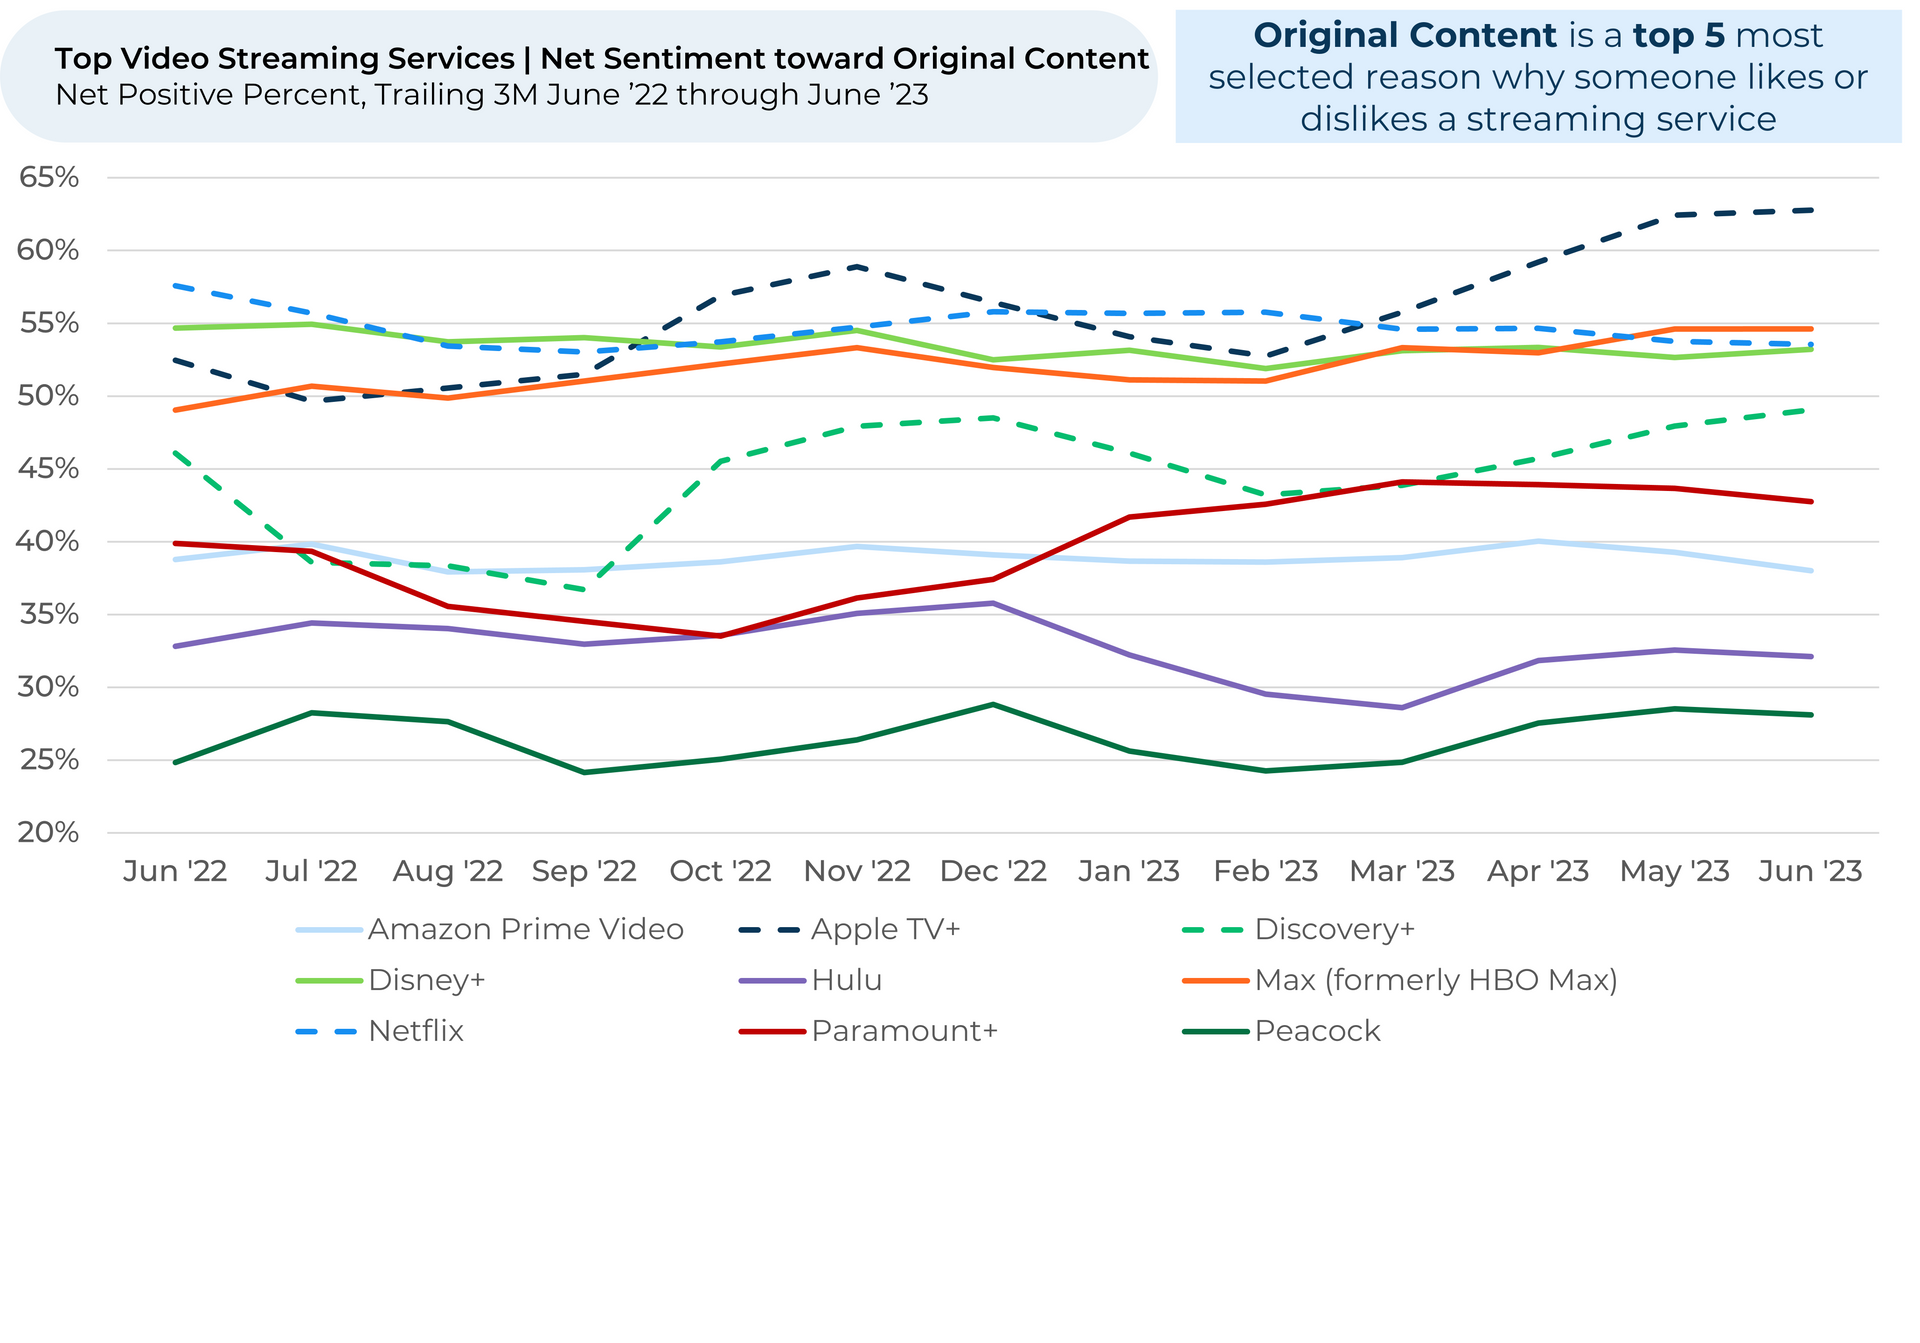
  • Viewers increasingly like Apple TV+’s original content. Apple TV+ released a string of popular content recently, including the shows Hijack, The Crowded Room, and Silo. Over the past three months, Usage Intent1,2 increased 6% and net sentiment3 toward Original Content grew 7%.
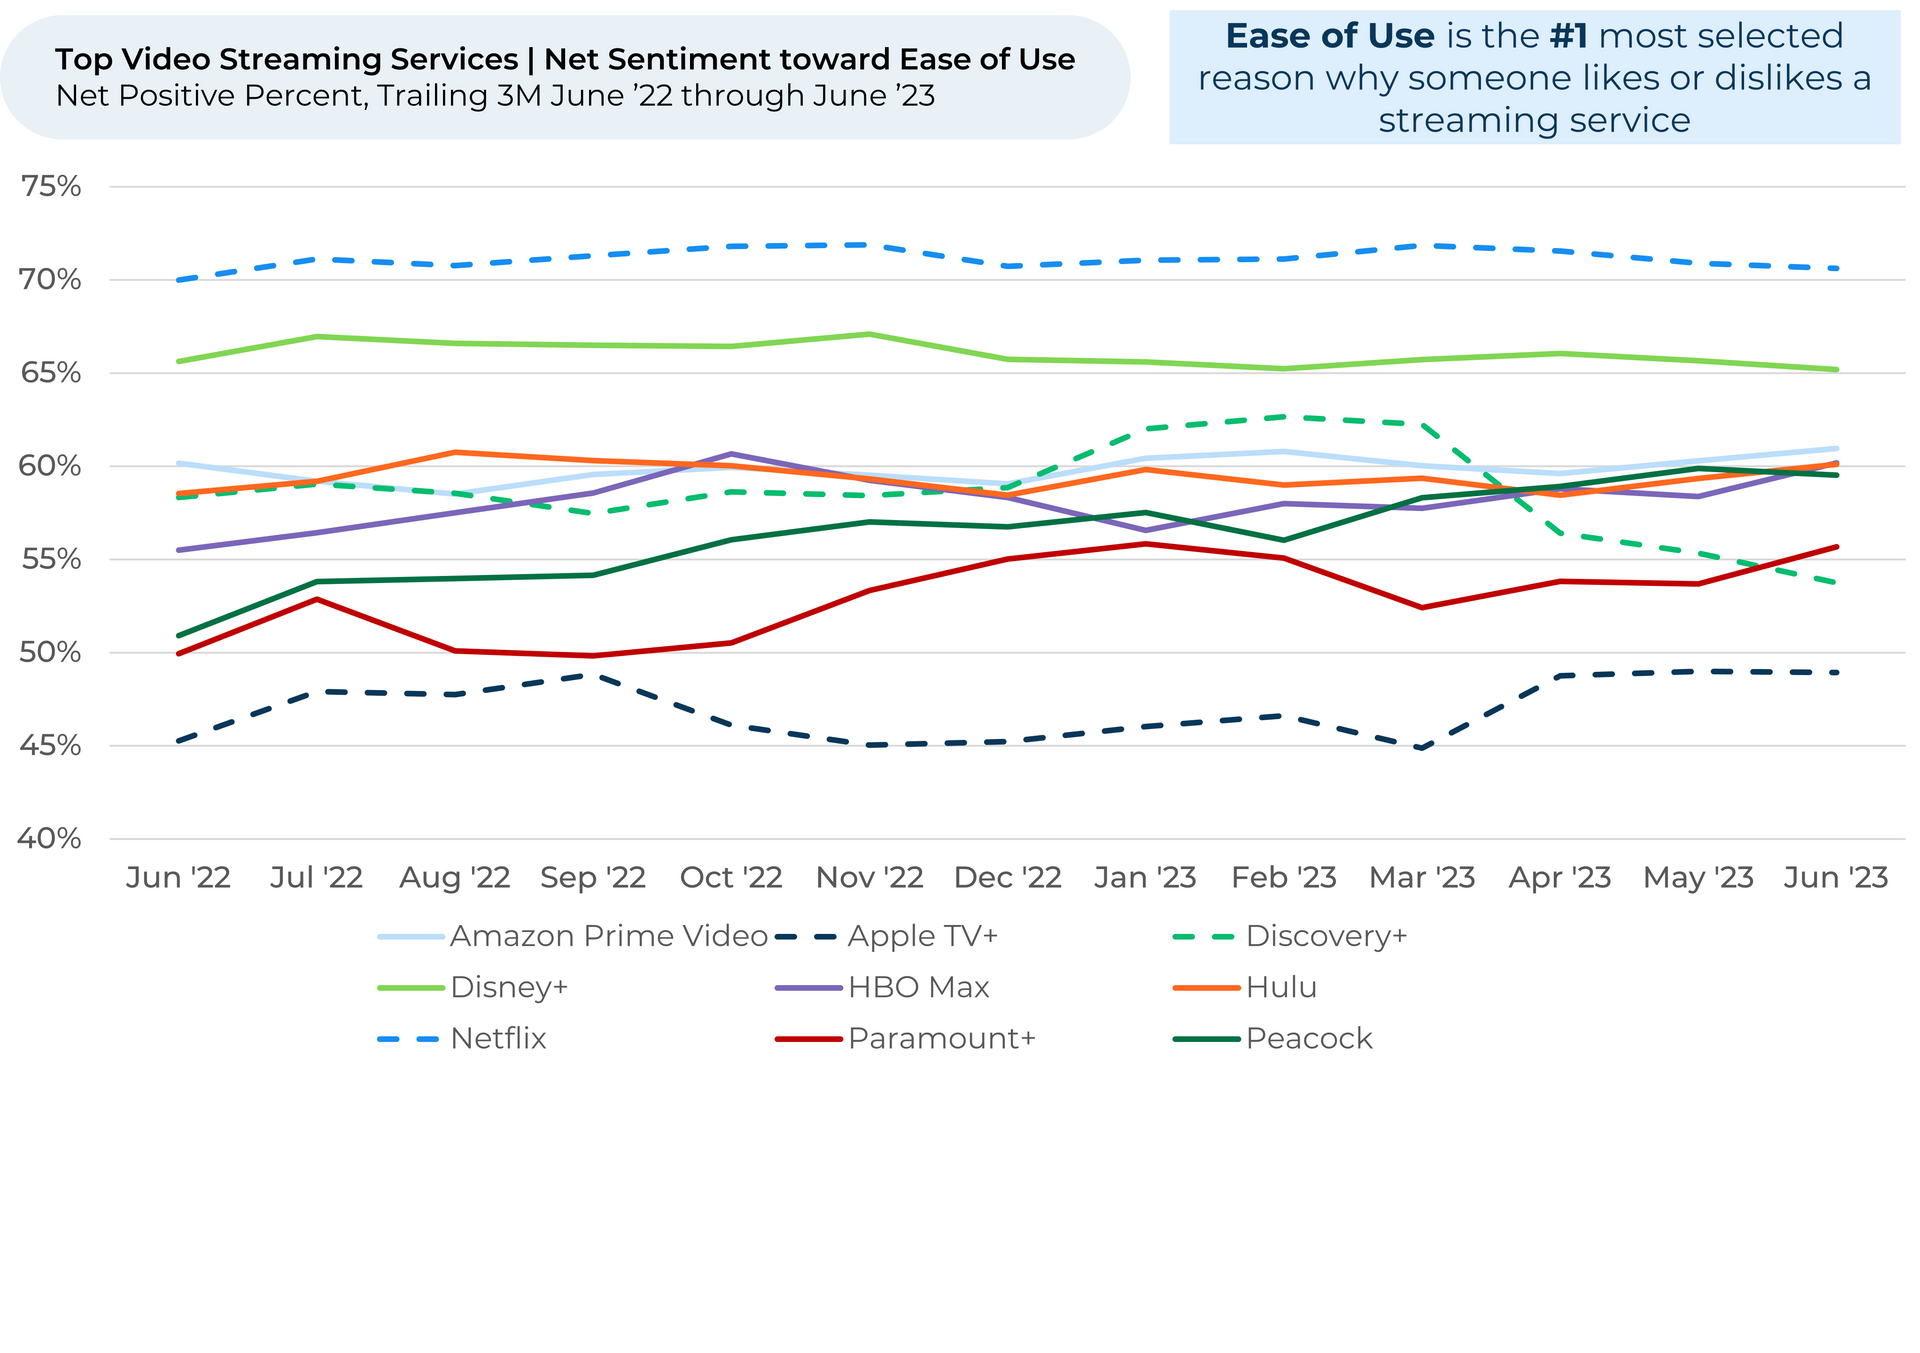
  • Concerns about the May release of Max cannibalizing Discovery+ appear to be playing out. More people are saying they plan to use Discovery+ less, with Usage Intent sinking 3% over the past three months. Viewers also feel less positive about Discovery+’s ease of use.
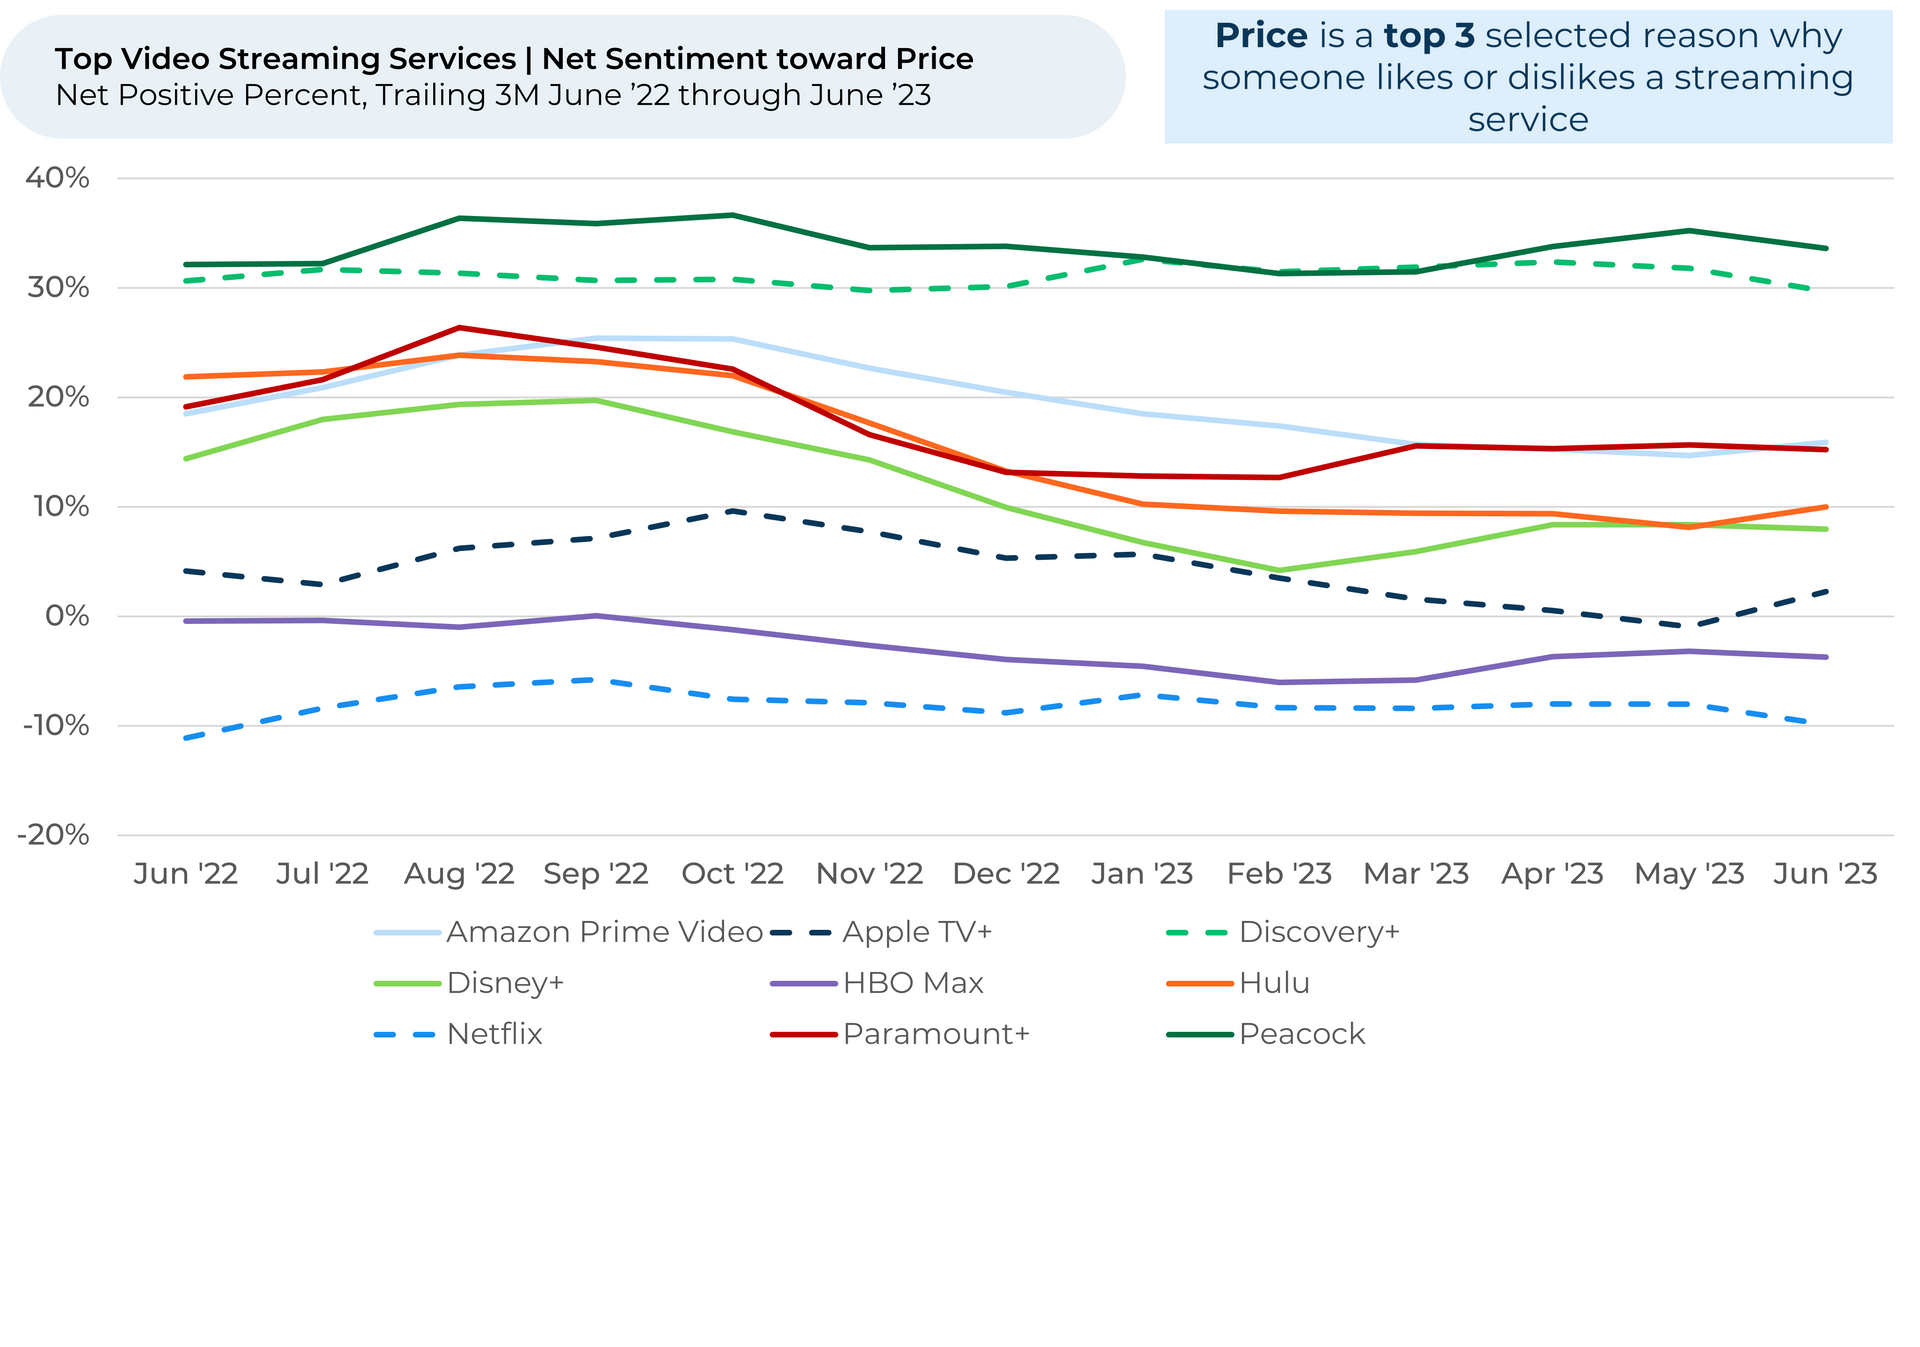
  • Viewers are souring on Netflix’s prices, subscription options, and account management options. All dipped 2% in net sentiment over the past month, coinciding with Netflix’s account sharing ban.
  • Our proprietary, AI-driven Resource Allocation model indicates these companies are focusing on the right areas to gain market share, and the outcome is likely to come down to execution. Apple TV+ and Max on increasing the volume and variety of quality content and Netflix on subscription options that resonate with its customers. 


Discover HundredX insights into Video Streaming Trends:

  • A person is holding a remote control in front of a television.

    Slide title

    Write your caption here
    Button
  • A graph showing a number of lines going up and down

    Slide title

    Usage Intent for video streaming remained relatively stable in June vs. the last three months. Most other areas dipped 1%-2%, while video games gained 2%. ​

    Button
  • A graph showing a number of lines and numbers on a white background.

    Slide title

    Apple TV+ (+6%), Discovery+ (-3%), and Netflix (-2%) are among the biggest Usage Intent movers over the past three months. Most of its biggest competitors generally remained within a range. ​

    Button
  • A graph showing a number of lines going up and down

    Slide title

    Apple TV+’s Intent gain seems to be driven by its original content. Net sentiment toward Original Content increased 7% over the past three months, surging ahead of competitors. Apple TV+ released a string of popular content recently, including the shows Hijack, The Crowded Room, and Silo. ​

    Button
  • A graph showing a number of lines on a white background

    Slide title

    Discovery+ dipped 3% in Usage Intent as customers became unhappier with the service’s ease of use. Ease of Use net sentiment dipped 8% since March. Notably, Max launched in May, featuring a simpler, more modern interface than Discovery+. ​

    Button
  • A graph showing a number of lines going up and down

    Slide title

    Customers are also souring on Netflix’s prices, with Price net sentiment dipping 2% the past three months. Since Netflix implemented a controversial password-sharing crackdown with incremental fees in May, its users also feel worse about its account management (-2%) and subscription options (-2%).​

    Button

Please contact our team for a deeper look at HundredX's video streaming data, which includes more than 210,000 pieces of customer feedback across 23 streaming services.


  1. All metrics presented, including Net Usage Intent (Usage Intent), and Net Sentiment / Net Positive Percent are presented on a trailing three-month basis unless otherwise noted.
  2. Usage Intent reflects the percentage of customers who plan to use a specific brand more during the next 12 months, minus the percentage who plan to use less. We find businesses that see customer Intent trends gain versus the industry have often seen revenue growth rates, margins and/or market share also improve versus peers.
  3. HundredX measures net sentiment toward a driver of customer satisfaction as Net Positive Percent (NPP), which is the percentage of customers who view a factor as a positive (reason they liked the products, people, or experiences) minus the percentage who see the same factor as a negative.

Strategy Made Smarter


HundredX works with a variety of companies and their investors to answer some of the most important strategy questions in business:

  • Where are customers "migrating"?
  • What are they saying they will use more of in the next 12 months?
  • What are the key drivers of their purchase decisions and financial outcomes?


Current clients see immediate benefits across multiple areas including strategy, finance, operations, pricing, investing, and marketing.


Our insights enable business leaders to define and identify specific drivers and decisions enabling them to grow their market share.


Please contact our team to learn more about which businesses across 75 industries are best positioned with customers and the decisions you can make to grow your brand’s market share.

####


HundredX is a mission-based data and insights provider. HundredX does not make investment recommendations. However, we believe in the wisdom of the crowd to inform the outlook for businesses and industries. For more info on specific drivers of customer satisfaction, other companies within 75+ other industries we cover, or if you'd like to learn more about using Data for Good, please reach out: https://hundredx.com/contact.

Share This Article

November 26, 2024
HundredX helps fill in the blanks left by traditional data providers
A stack of coins with the words consumer spending muted amid rising prices
November 7, 2024
Consumers are navigating still-high prices with resilience. HundredX analysis, based on millions of pieces of customer feedback from July 2021 through April 2023 across 3,200+ companies, indicates inflation remains persistent, but consumers are cautiously hanging on. New Consumer Price Index (CPI) data shows prices increased 3.4% in April from a year ago, compared to 3.5% in March, which highlights a slight easing in inflation month-to-month. Still, HundredX data shows that consumers still feel negative about prices in general, pointing to inflation’s stickiness and consumer frustrations over the consistently high prices of everyday goods. Generally, we’ve seen that changes to HundredX’s Price favorability index are typically inversely correlated with movement in the CPI levels (i.e., inflation) reported by the US government.
October 26, 2024
HundredX Announces Strategic Alliance with FGS Global
Share by: