Continued loosening of COVID restrictions around the country, an evolving economic outlook and rapid innovation have made it a very interesting time to be a consumer looking to be entertained. Each month we have been analyzing trends across various entertainment sectors, with one area of focus being the rapidly changing video streaming market.
Last month, we found Netflix subscribers’ have finally come to terms with last year’s price increase and its new ad-supported tier. Recently, Warner Bros. Discovery announced it will be launching its rebranded “Max” streaming service and Netflix announced the end of its DVD-by-mail service.
Analyzing more than 530,000 pieces of feedback across the entertainment sector and 100,000 pieces of feedback from “The Crowd” of real customers of 17 video streaming services, we find:
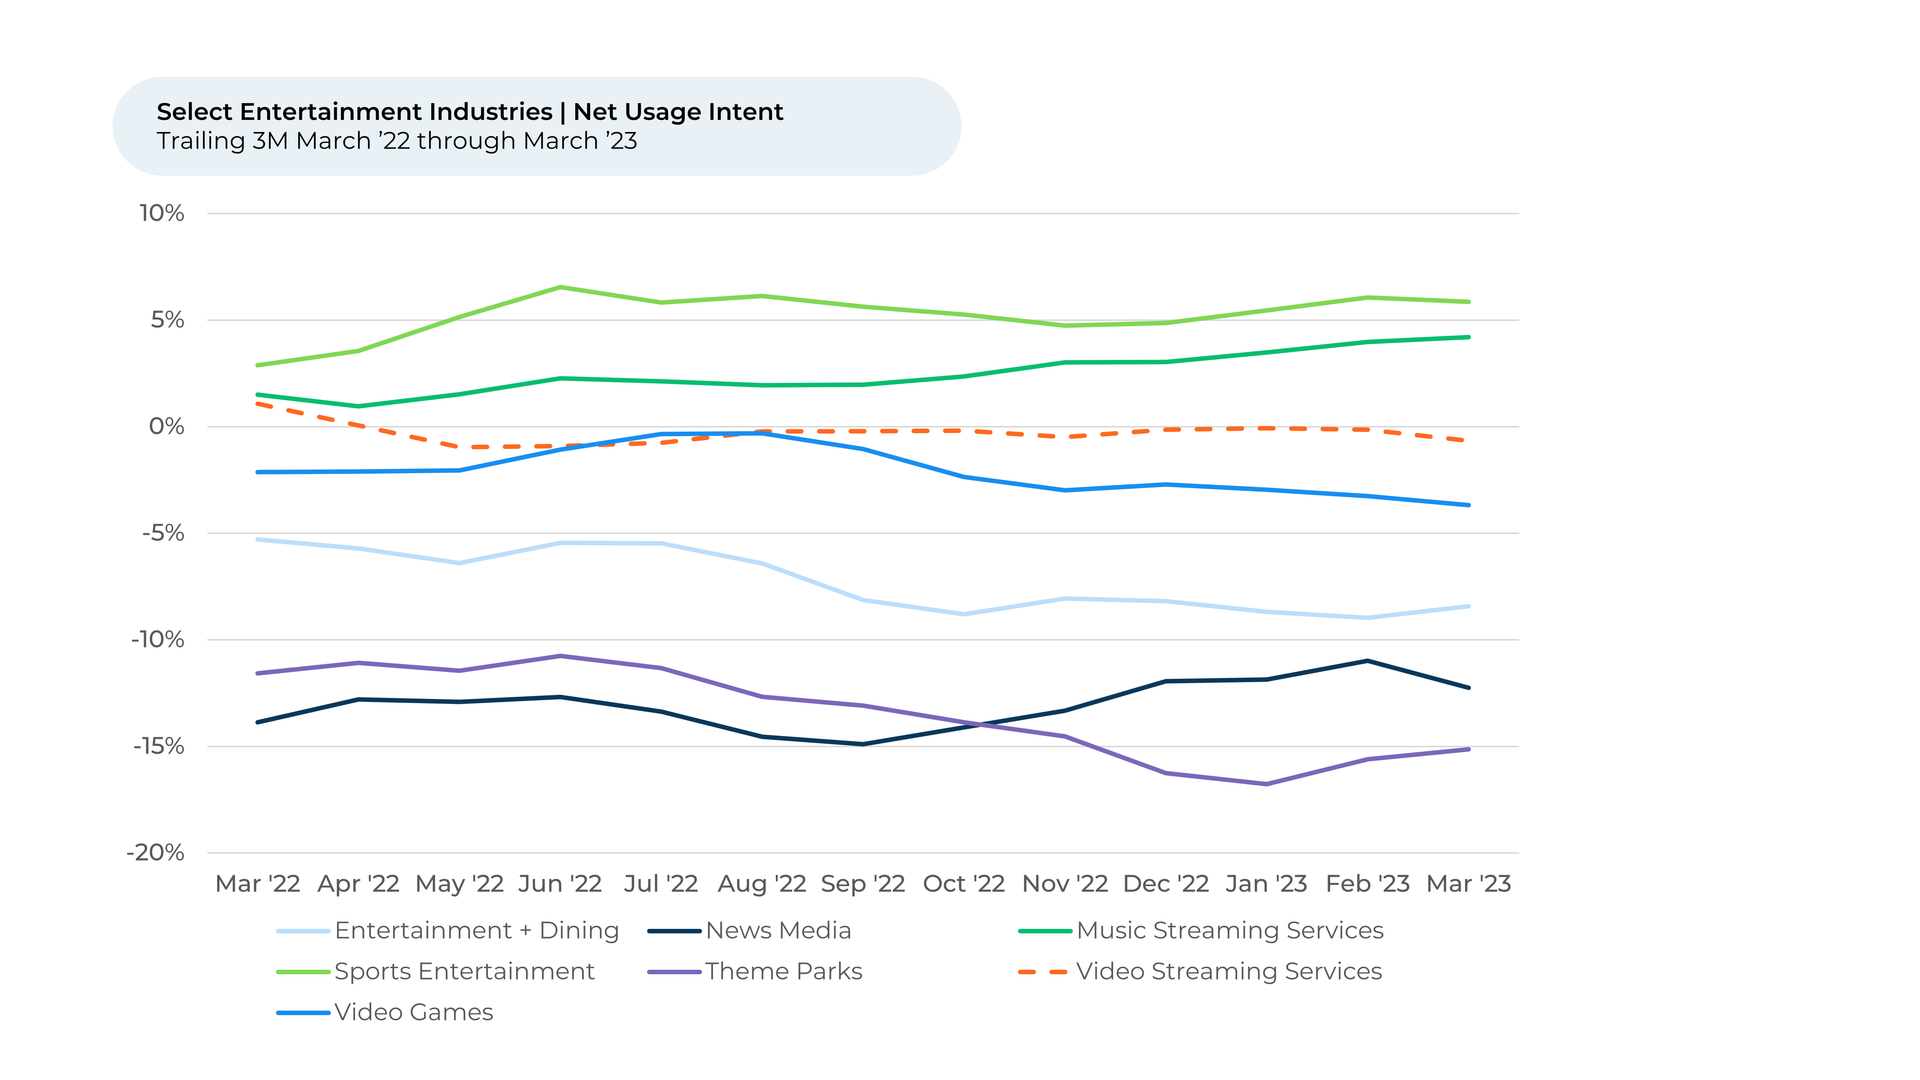
- Video Streaming Usage Intent1,2 has dipped over the past month, even as it stayed stable for many other Home Entertainment industries.
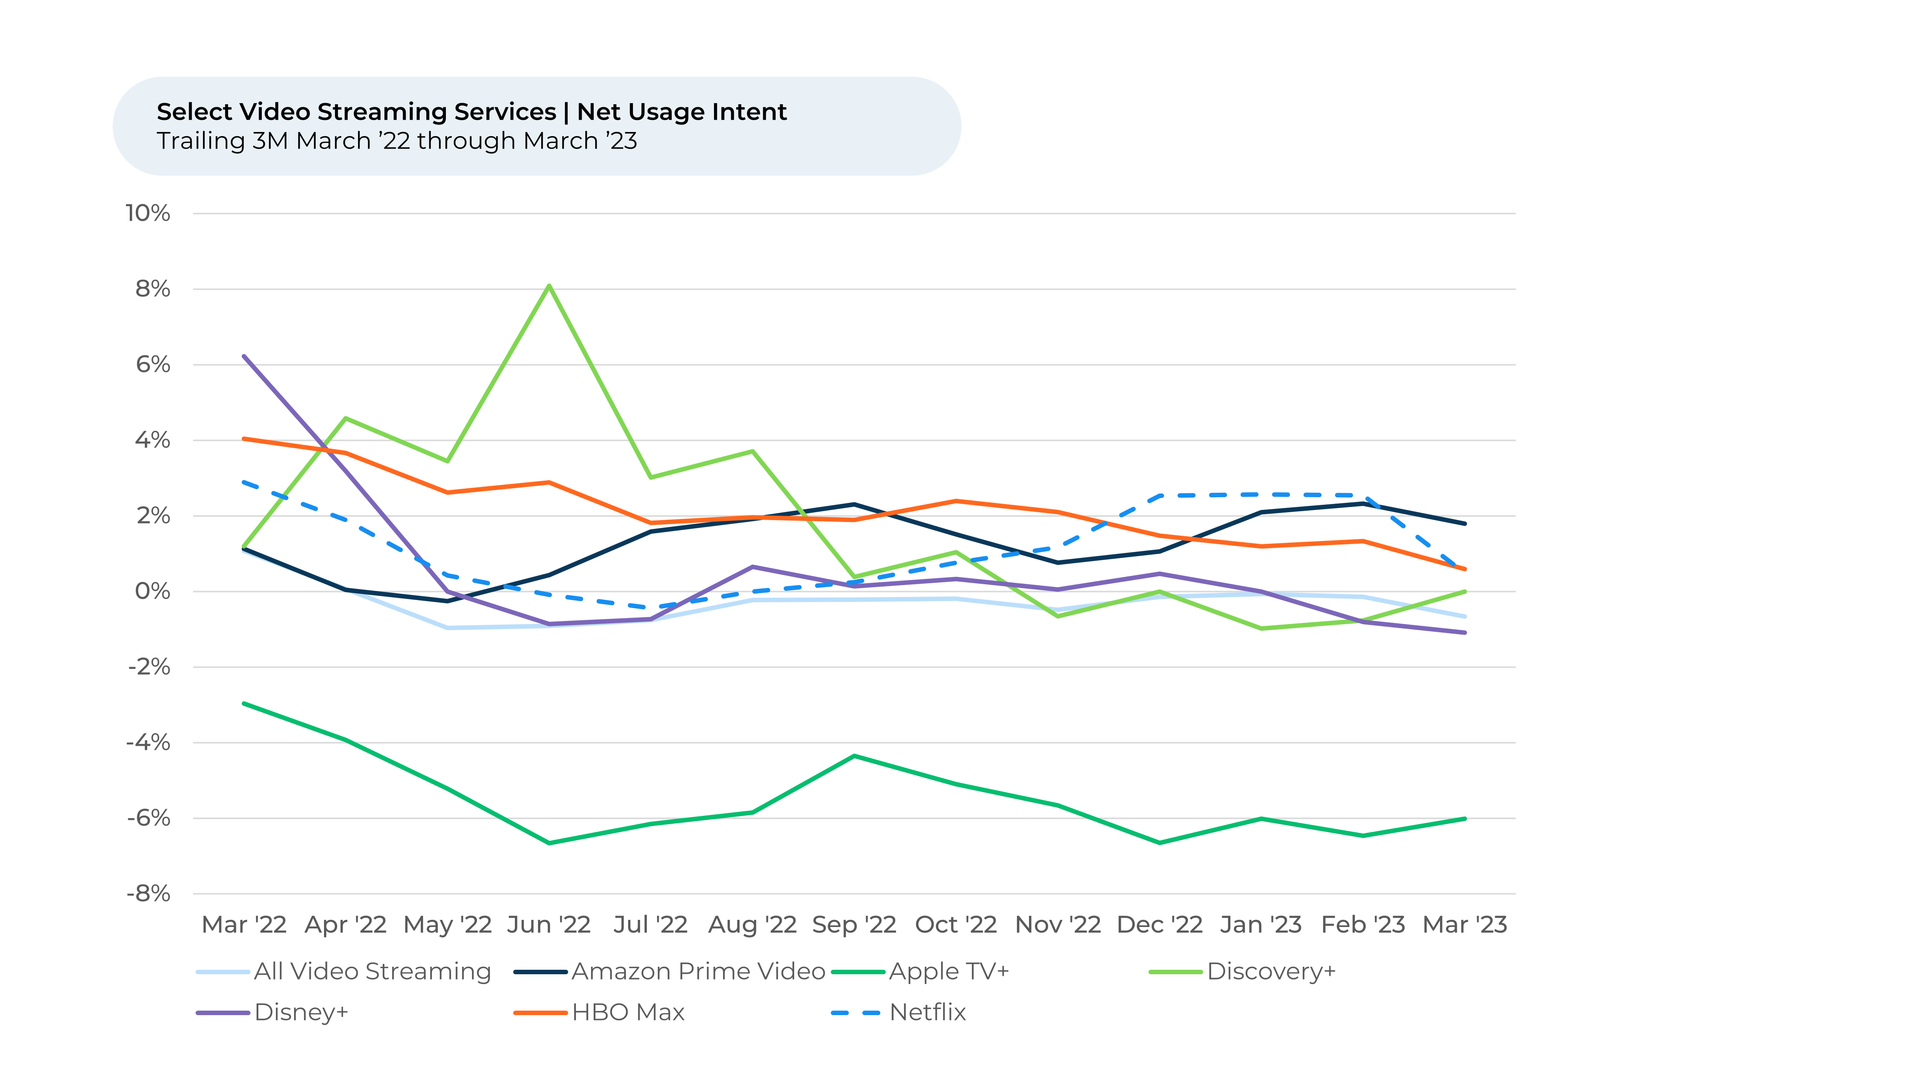
- Netflix is among several streaming services that contributed to the drop. Netflix Usage Intent fell 3% from February to March, losing the gains it made after introducing a cheaper, ad-supported tier in November.
- Netflix cut its content budget and Netflix customer sentiment3 towards new releases and value dipped. As competitors like Amazon Prime ramp spending on content, Netflix may need to consider raising content spend to sustain share.
- Over the past quarter, however, customers do feel more positively about Netflix’s ease of use, technical performance, and navigation, possibly reflecting credit for smart investments Netflix made to improve its iPhone app interface.
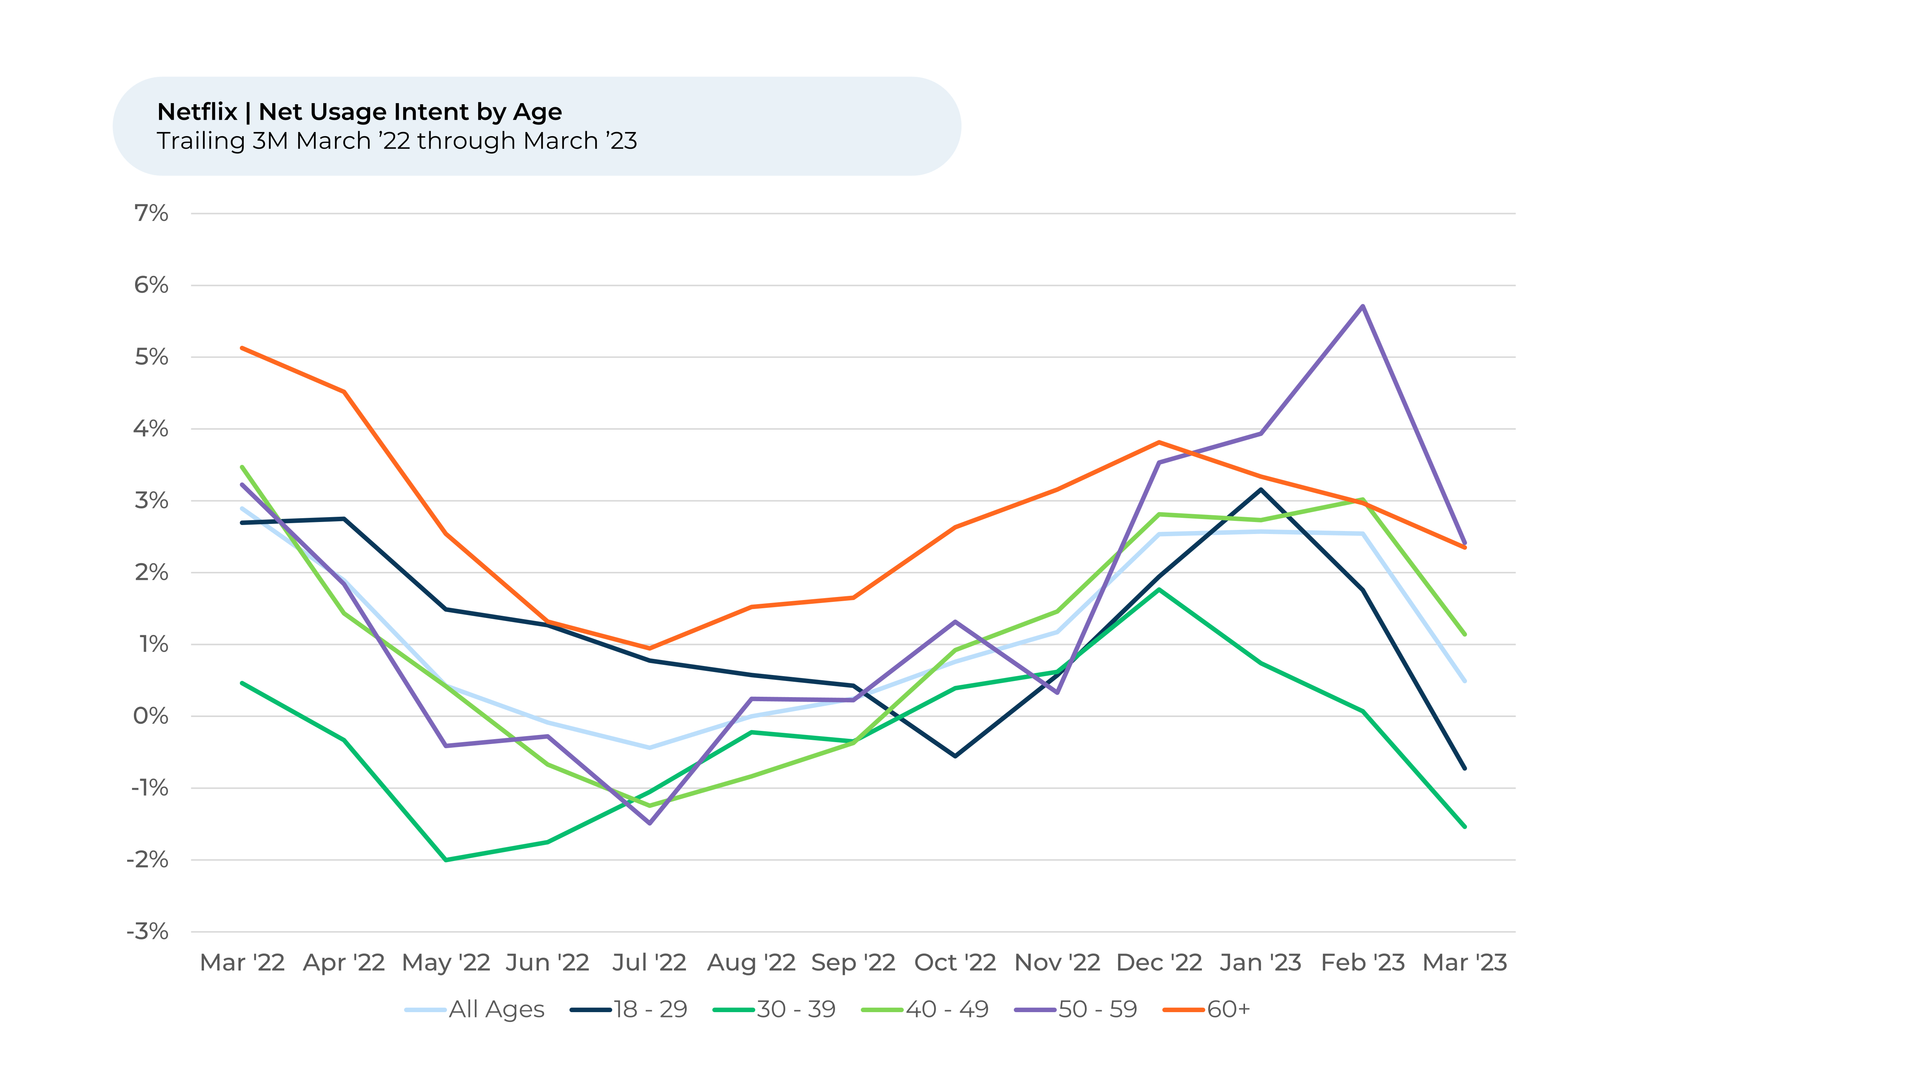
- Netflix Usage Intent is highest among older users, with some using Netflix’s now-ended DVD-by-mail service recently. We will watch for the impact of the service’s discontinuation on this group.
Usage Intent for Home Entertainment industries generally stayed stable over the past month. It dropped very slightly (-1%) for the video streaming sector and news media. At the same time, Usage Intent rose 1% for several experience-focused entertainment industries, including theme parks and entertainment & dining (e.g. Dave & Busters, Topgolf, Bowlero, etc.) With spring finally here, it’s possible people are moving away from their TVs and taking advantage of the warmer weather.

Despite the warmer weather, there are still plenty of people happy to hop on the couch and pull up their favorite show. Netflix, with a total global subscriber count that increased to 232.5 million as of March 2023, is proof of that.
“We have had Netflix probably about 10 years now we love the platform and the amount of programming available,” one Netflix subscriber recently told HundredX.
“Netflix is the best streaming service. The content is good and there is a wide variety. I never get bored,” another subscriber said recently.
Netflix’s subscriber count in North America is up by just over one million in the last two quarters, with the streaming service’s new ad-supported plan, launched in November, likely enticing people to sign up.

Netflix’s Usage Intent rose 2% from November to December even as it stayed stable for the overall video streaming industry. However, its Usage Intent fell 3% from February through March, eliminating the gains it had made at the end of 2022. The pullback in Usage Intent aligns with the recently reported slowdown in North American subscriber growth in 1Q 2023.
Netflix also announced during its earnings call that it is ending the DVD-by-mail service that started the media company 25 years ago. It’s not clear how many subscribers still used the service, but the Associated Press estimates it was between 1.1 million and 1.3 million customers. The service will wind down in September.
At least some HundredX respondents still used the service. “I am very pleased with our Netflix mail order DVD subscription which we have had for years,” one respondent told HundredX late last year.
Another respondent told HundredX in February, “I like being able to use mail order.”

It’s worth noting both respondents are people over the age of 60. Netflix Usage Intent is highest among subscribers in their 50s followed by subscribers in their 60s. It will be interesting to see how the end of the DVD-mail service impacts this.
New Releases Down, Ease of Use Up
During the past quarter, Netflix customers have felt slightly more negative about a few Netflix attributes, including its value and new releases. Both continued their decline (-1% each) over the past month. While Netflix subscribers do generally like Netflix’s new releases, it appears they weren’t as happy with the new content the streaming giant put out over the past three months. This coincides with Netflix reducing its content spend to $2.5 billion in Q1 2023, down from $3.6 billion in Q1 2022.
At the same time, Netflix subscribers did feel happier about Netflix’s ease of use, navigation, and technical performance. This seems to correspond to updates Netflix made to its iPhone app in January, which provided users with a visual user interface (UI) upgrade and made it easier for users to search for content.
A platform’s ease of use, its price, and its content variety are top reasons a video streaming subscriber likes or dislikes a streaming service.
“Easy to navigate, even for someone not tech savvy,” a HundredX feedback provider said of Netflix in late January.
“We watch Netflix almost every night. I love the ease of finding a show or movie. The recommendations are usually accurate,” another person said in March.
As the video streaming industry evolves, Netflix continues enhancing its services in an attempt to stay ahead of the curve and adapt to new trends and user preferences. Our Usage Intent and sentiment data suggests that to foster growth, Netflix should focus on:
- Making more investments in original programming and diverse content.
- Expanding its lower-cost, ad-supported tier to attract price-sensitive customers.
- Continuing to enhance user experience and navigation to ensure customer satisfaction.
By following these strategies, Netflix will likely continue to drive growth and dominate the streaming market. As the platform evolves, we'll be closely observing how these changes impact Usage Intent and, ultimately, the company's bottom line.
- For this piece, all metrics presented, including Net Usage Intent (Usage Intent), and Net Positive Percent / Sentiment are presented on a trailing one-month basis unless otherwise noted.
- Usage Intent reflects the percentage of customers who plan to use a specific brand during the next 12 months minus the percentage who plan to use less.
- HundredX measures sentiment towards a driver of customer satisfaction as Net Positive Percent (NPP), which is the percentage of customers who view a factor as a positive (reason they liked the products, people, or experiences) minus the percentage who see the same factor as a negative.
Strategy Made Smarter
HundredX works with a variety of companies and their investors to answer some of the most important strategy questions in business:
- Where are customers "migrating"?
- What are they saying they will use more of in the next 12 months?
- What are the key drivers of their purchase decisions and financial outcomes?
Current clients see immediate benefits across multiple areas including strategy, finance, operations, pricing, investing, and marketing.
Our insights enable business leaders to define and identify specific drivers and decisions enabling them to grow their market share.
Please contact our team to learn more about which businesses across 75 industries are best positioned with customers and the decisions you can make to grow your brand’s market share.
####
HundredX is a mission-based data and insights provider. HundredX does not make investment recommendations. However, we believe in the wisdom of the crowd to inform the outlook for businesses and industries. For more info on specific drivers of customer satisfaction, other companies within 75+ other industries we cover, or if you'd like to learn more about using Data for Good, please reach out: https://hundredx.com/contact.


